Figures & data
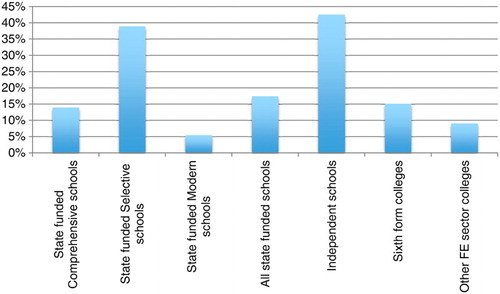
Figure 1. Percentage of A level cohort achieving grades AAB* or better by institution type in 2013/14 (any subjects). Notes: *A level or applied single/double award A level. Modern schools and comprehensives admit pupils of any ability. Secondary modern schools will have grammar schools in their area which admit most local high ability pupils and may therefore have a different intake compared to comprehensive schools which are not in grammar school areas. Source: Department for Education, Statistical First Release 03/2015. https://www.gov.uk/government/statistics/a-level-and-other-level-3-results-2013-to-2014-revised.