Figures & data
Figure 1. Attitudes towards the common teaching of pupils with different language skills.
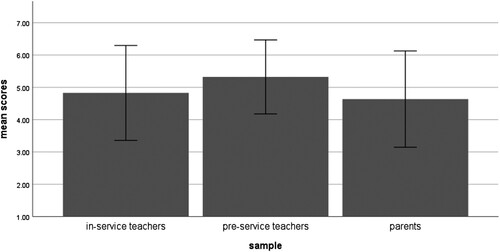
Table 1. Mean scores towards the common teaching of pupils with different language skills.
Figure 2. Attitudes towards the common teaching of pupils with different language skills separately for female and male participants.
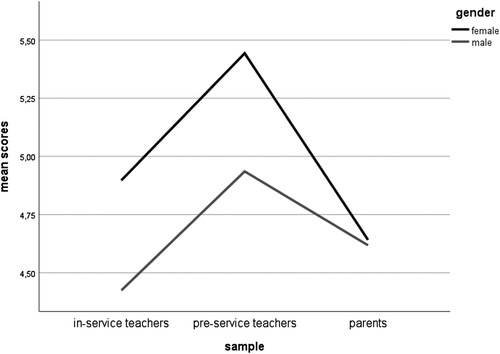
Figure 3. Attitudes towards the common teaching of pupils with different language skills separately for participants with and without migration background.
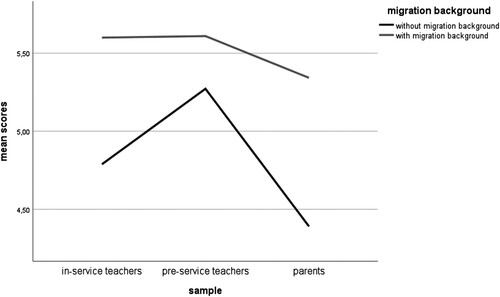
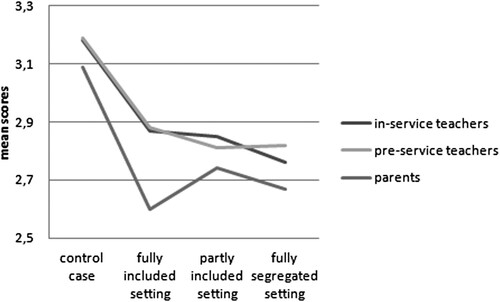
Figure 4. Mean scores and standard deviations of the different integration settings of in-service teachers, pre-service teachers and parents.
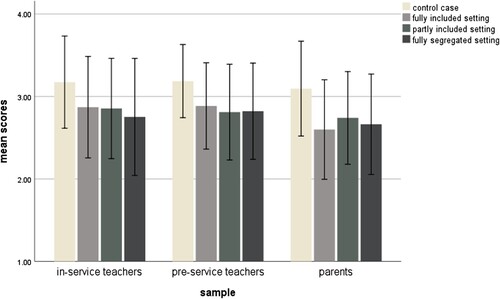
Table 2. Mean scores of the attitudes towards the development of the pupils in the different integration settings.
Figure 5. Attitudes towards the development of pupils within the different integration settings separately for the three sub-groups.