Figures & data
Table 4. S-ETUQ descriptive data.
Table 1. META observable performance skills.
Table 2. Sociodemographic characteristics, MMSE scoring, general ability measure and FAI.
Figure 1. Scatter-Plot visualizing the relationship between measures of perceived and observed ability to use ET over the whole group, the MCI group and the dementia group. Note: higher scores indicate greater ability. Individual A: observed ability (META)=4.26 logits, perceived ability (S-ETUQ)=63.36 logits. Individual B: observed ability (META)=1.61 logits, perceived ability (S-ETUQ)=70.89 logits.
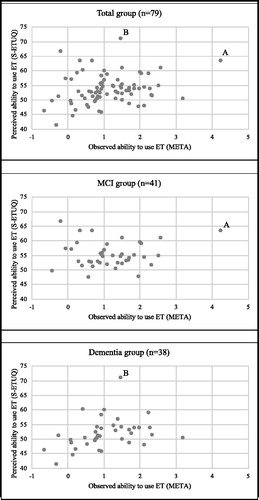
Table 3. Means of S-ETUQ and META, correlations.
Table 5. Descriptive results META observations.
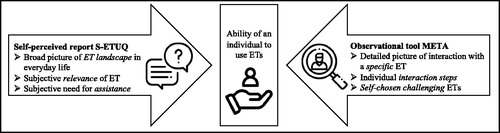
Figure 2. Unique characteristics of the S-ETUQ and META.