Figures & data
Table 1. Chemical compositions of TRIP and DP steels (in wt-%, with Fe balance).
Figure 1. Temperature-dependent thermal properties of (a) the TRIP and (b) the DP steel with chemical compositions defined in Table .
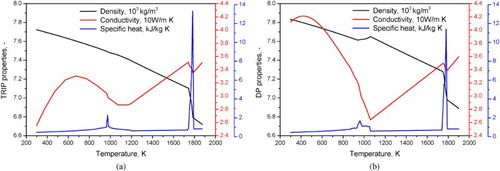
Table 2. Energy parameters for liquid-to-δ-ferrite phase interaction.
Figure 2. Microstructures on the top surfaces of (a) the TRIP, (b) the DP steel and (c) magnified microstructure of the DP steel after laser welding.
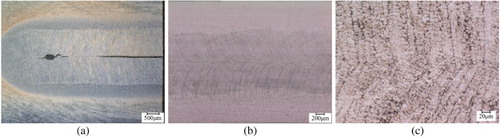
Figure 3. (a) Temperature (K) distribution in the DP steel predicted from the FE model, (b) transient temperature validation at three locations on both sides of the weld (B: on the free edge side, T: on the fixed edge side).
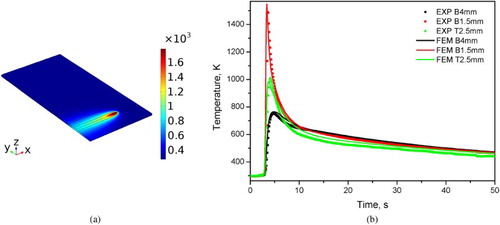
Figure 4. (a) Simulated time–temperature profiles of the TRIP and the DP steel at the weld centre line, (b) schematic of the phase field region modelled.
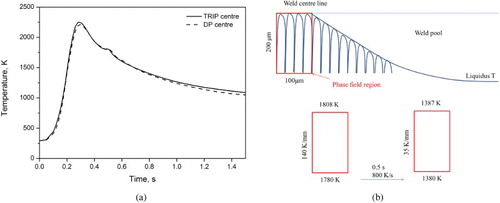
Figure 5. Phase evolution of the DP steel during solidification up to 0.13 s (red: liquid, blue: grain boundary and yellow: δ-ferrite).
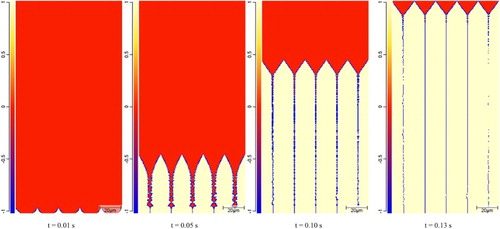
Figure 6. Phase distributions in the TRIP and the DP steel when the dendritic tips reach the weld centre line.
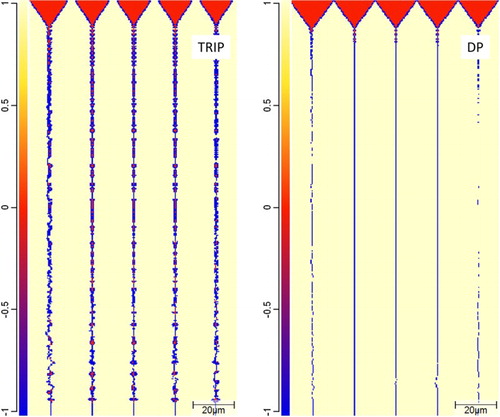
Figure 7. Phase distributions along a vertical grain boundary for the TRIP and the DP steel (number ‘0’, ‘1’, ‘−1’ represent liquid, δ-ferrite and grain boundary).
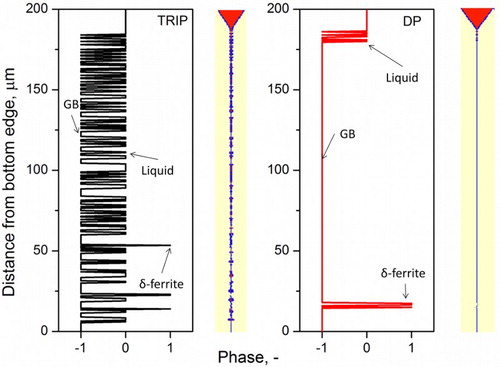
Figure 8. Distribution of phosphorus (wt-%) in the TRIP and the DP steel when the dendritic tips reach the weld centre line.
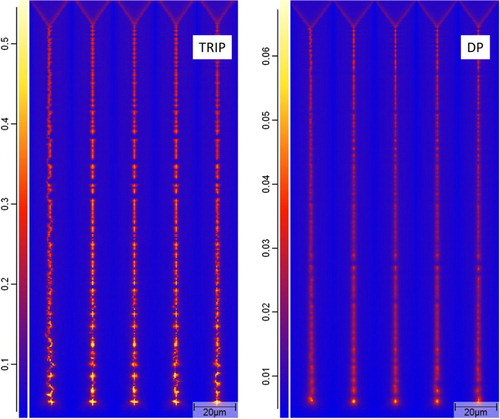
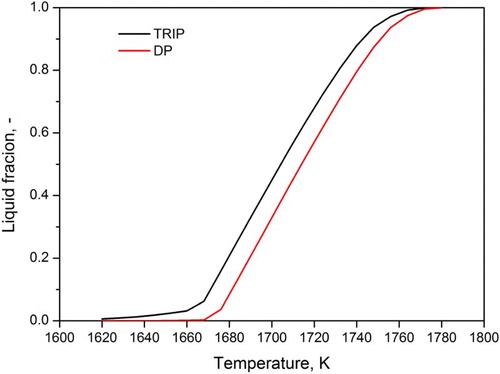
Figure 9. Liquid fraction as a function of temperature for the TRIP and the DP steel.