
Figures & data
Table 1. Italy’s EXMIPO: Main tools.
Figure 1. Arrivals via the Mediterranean and asylum applications to Italy, 2000–2022.
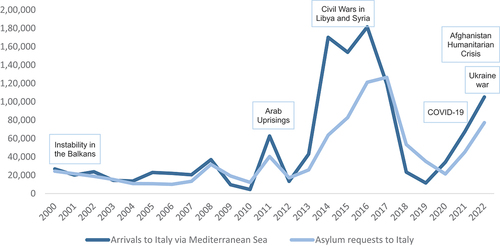
Figure 2. Number of agreements by type and year, 1990–2022.
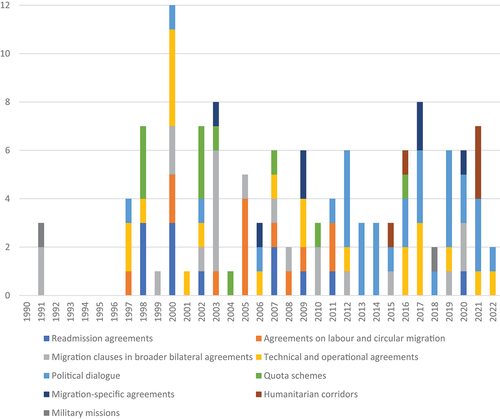
Figure 3. Number of tools by type, 1990–2022.
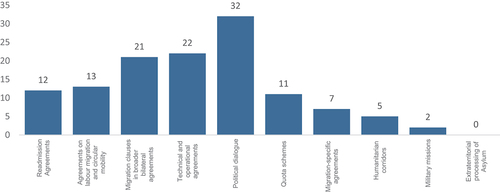
Table 2. Italy’s readmission agreements and quota schemes.
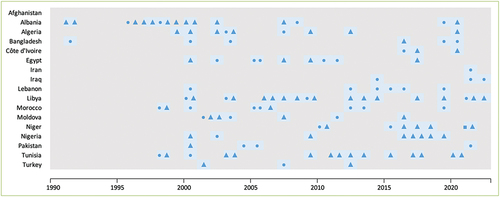
Figure 4. Number of agreements by country, 1990–2022.
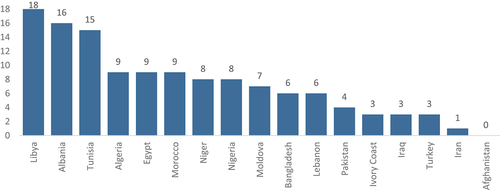
Figure 5. EXMIPO instruments by region and year, 1990–2022.
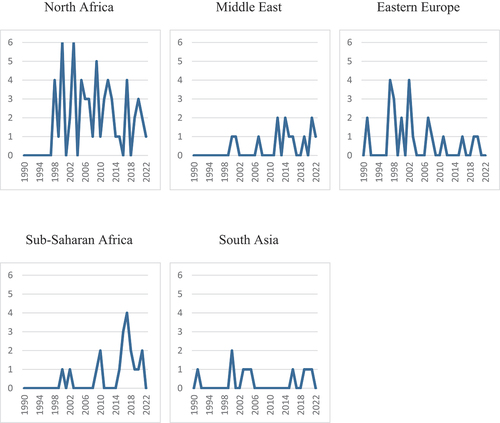
Figure 6. EXMIPO tools by focus area, 1990–2022.
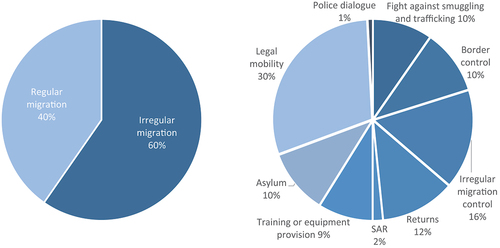
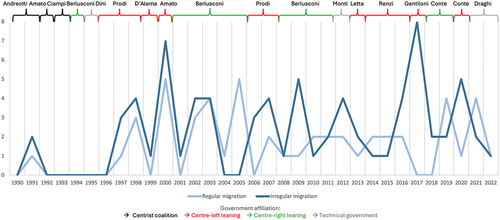
Figure 7. EXMIPO tools by focus area, government, and year, 1990–2022.
Source: Author elaboration. Grey background: no tool in given year. Blue background: new tool adopted. Symbols Respect tools main focus areas (as defined in the text): ●= regular migration; ▲ = irregular migration; ■= other.
Data availability statement
The dataset underpinning this publication can be accessed at https://umap.openstreetmap.fr/en/map/depmi-dimensione-esterna-politica-migratoria-itali_711517#4/37.34/11.34