Figures & data
Figure 1. BRBGF specimen with the dowelled connections (Dong et al. Citation2020b).
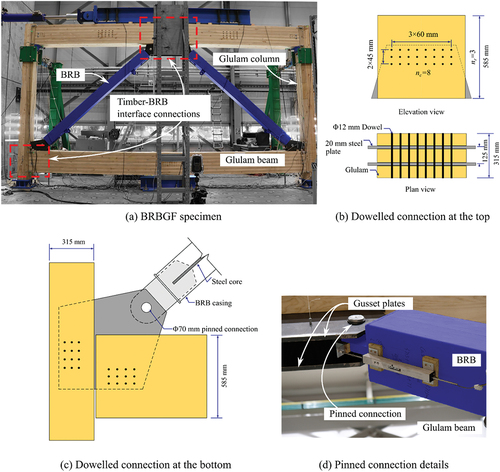
Figure 2. Comparison of BRBGF hysteresis curves (Dong et al. Citation2021).
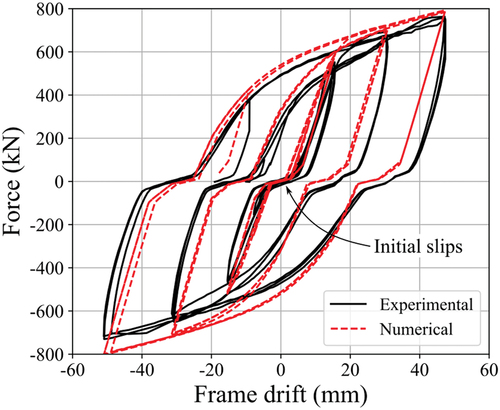
Figure 3. DDBD design approach (Priestley, Calvi, and Kowalsky Citation2007).
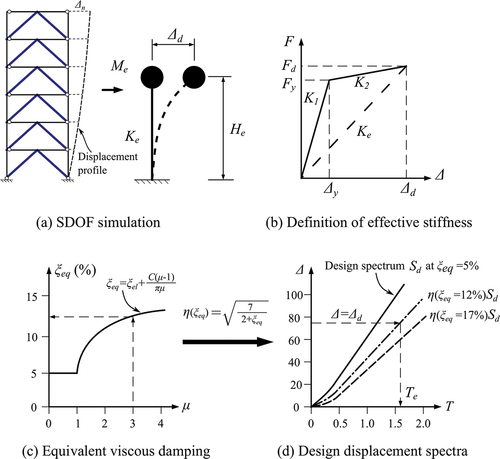
Figure 4. Assumed displacement profile.
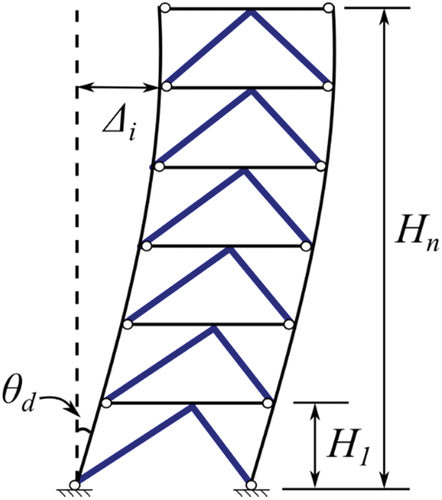
Figure 5. Numerical model of the one-storey BRBGF.
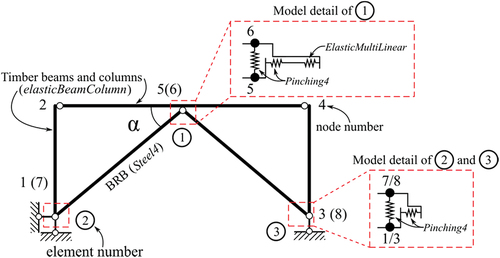
Figure 6. Yield drift definition.
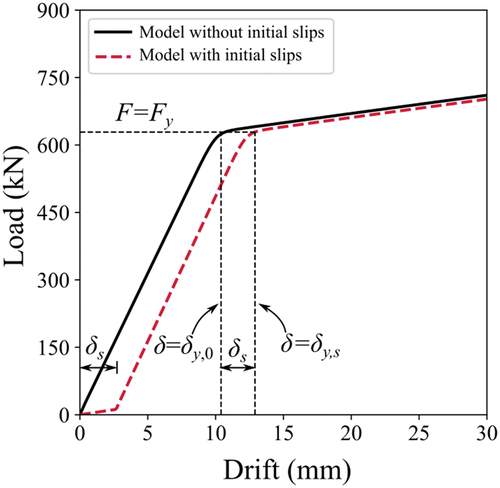
Figure 7. Yield drift components (a) the inter-storey drift contribution of the BRB deformation δy,i,BRB; (b) the inter-storey drift contribution of the column axial deformation δy,i,col.
Figure 8. BRBGF spring analogy.
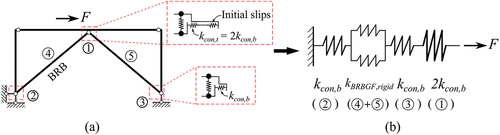
Figure 9. Comparison between the component-based model and Takeda fat model.
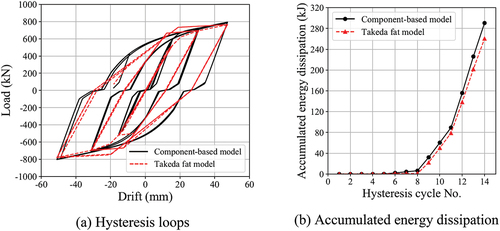
Figure 10. Takeda fat model (Priestley, Calvi, and Kowalsky Citation2007).
Table 1. Parameters of one-storey BRBGF models.
Table 2. Results of stiffness adjustment factor λ.
Figure 11. Procedure of parameter verification.
Table 3. Ground motion records and scale factors for NLTHA.
Figure 12. Acceleration spectra scaling process.
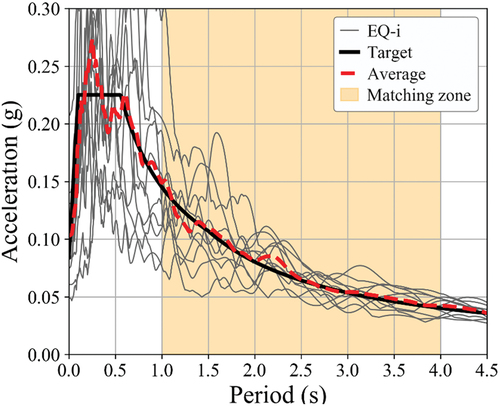
Figure 13. Verification of η–μ relationship.
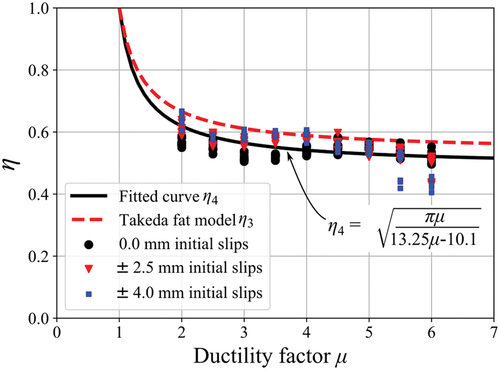
Table 4. Loading information of case study buildings.
Figure 14. BRBGF-6 design example.
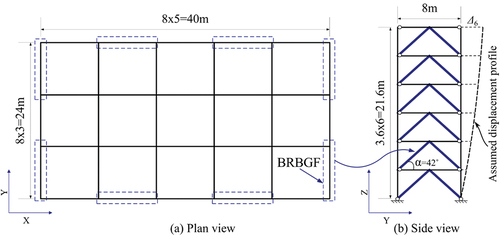
Table 5. Design parameters of BRBGF-6.
Figure 15. Adjusted displacement spectrum.
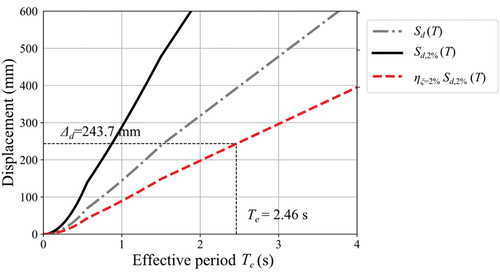
Table 6. DDBD information of case study buildings.
Table 7. Member size information of BRBGF-3.
Table 8. Member size information of BRBGF-6.
Table 9. Member size information of BRBGF-9.
Figure 16. Six-storey BRBGF OpenSees model.
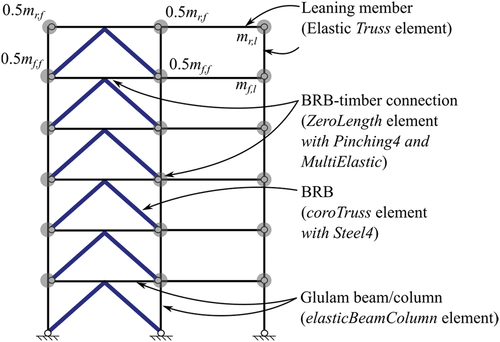
Figure 17. Comparison of damping ratio.
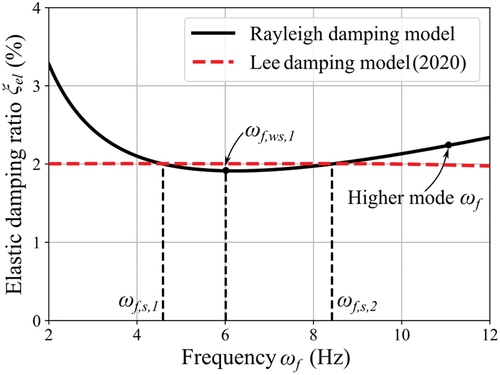
Figure 18. Acceleration spectrum and displacement spectrum matching.
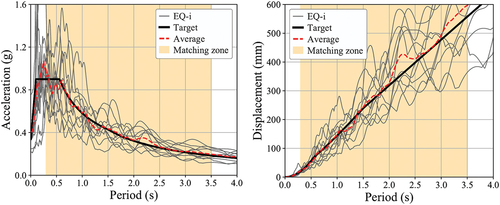
Figure 19. Maximum displacement profile and inter-storey drift ratio response. (a) BRBGF-3. (b) BRBGF-3. (c) BRBGF-6. (d) BRBGF-6. (e) BRBGF-9. (f) BRBGF-9.
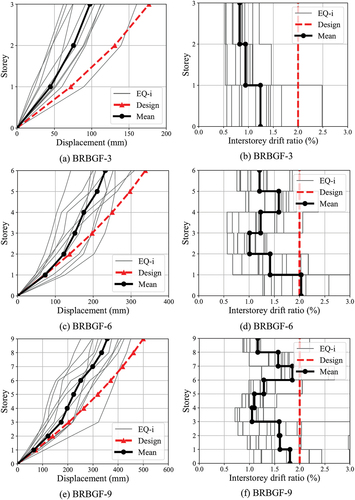
Table 10. Combined strength factors of glulam members.
Figure 21. Damping ratio-frequency relationship of the Lee damping model