
Figures & data
Table 1. Means and standard deviations of the study variables as a function of level, gender and track.
Table 2. Correlations among Study Variables.
Table 3. Fit Statistics of Latent Profile Analysis for Students’ Motivational Profiles.
Figure 1. Z-scores for motivational regulations of the four-cluster solution.
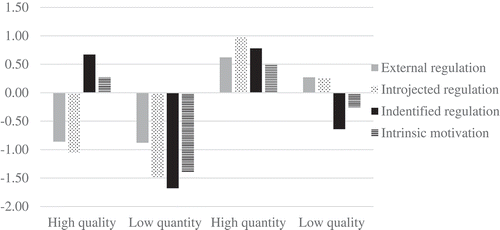
Table 4. Means scores, standard errors and analysis of variance on all study variables for the motivational profiles.