
Figures & data
Figure 1. Visualisation of the conceptual frame of the study in relation to the research questions.
Table 1. Students’ age, gender, prior education and relevant work experience (N = 264).
Figure 2. Bar chart representing the final clusters.
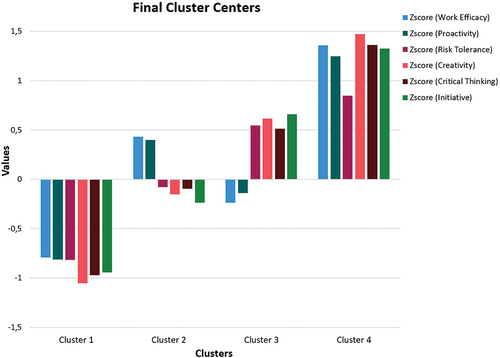
Table 2. Z scores for the attribute scales for the four extracted clusters, together with F values.
Table 3. Means and standard deviations for attributes and behavioural scale, per cluster.
Table 4. Chi-square table for relevant work experience per cluster.
Table 5. Characterisation of the student profiles based on students’ orientations and boundary-crossing behaviour.
Appendix A. Z Scores for the Constitutive Attribute Scales and Respective Items for the Four Extracted Clusters, Together with F Values (N = 264)