Figures & data
Figure 1. Sample disadvantage characteristics.
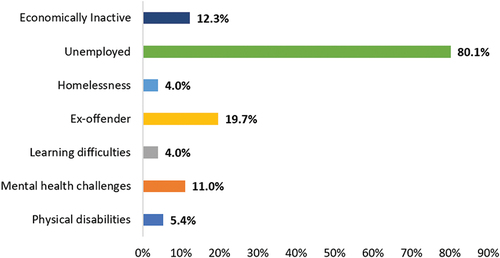
Figure 2. Phases of CCM analysis.
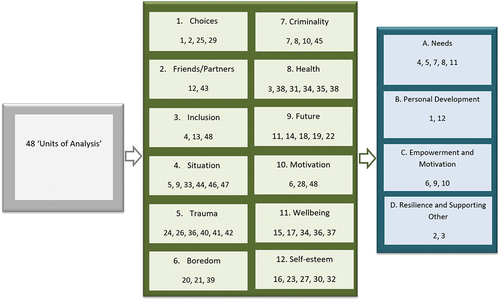
Table 1. GSE scores at T1 with disadvantage as the factor.
Table 2. Changes in participant GSE scores between T1 & T2.
Table 3. GSE scores at T2 with employment/training outcomes as the factor.
Figure 3. Increasing employability for individuals experiencing multiple disadvantage.