
Figures & data
Table 1. Assumptions for the production plan.
Table 2. Investments in on-growing facility.
Table 3. Assumptions regarding variable and fixed costs.
Figure 1. Weight curves for 500 g smolts.
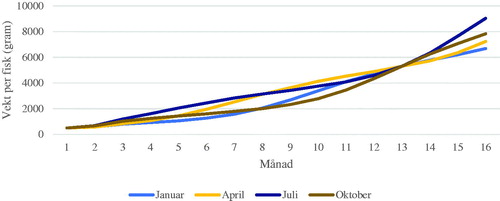
Table 4. Release program and fish weight over time (gram at beginning of the month).
Table 5. Release program and number of fish per site over time (number of fish at the beginning of the month given 0.75% monthly mortality).
Table 6. Estimated potential biomass based on and —before harvesting and adapting to MTB-constraint.
Table 7. Development in biomass over time—per site and for the company—adapted to company MTB.
Table 8. Harvest plan in number of fish per site, given planned standing biomass of 7,020 tonnes at the beginning of each month (“steady state” from year 2 onwards).
Table 9. Harvest per site and in total per month—based on average monthly weight in kg.
Table 10. Annual steady state production.
Table 11. Investments in sea-based on-growing facility (on-growing of 500-g smolts).
Table 12. Total costs per year and per kg (on-growing of 500 g post-smolts).
Figure 2. Weight curves for 100 g smolts.
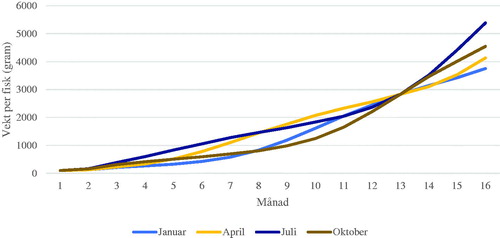
Table 13. Annual production with 100 g smolt.a
Table 14. Total costs per year and per kg 100 g smolts.
Figure 3. Weight curves for 1,000 g smolt.
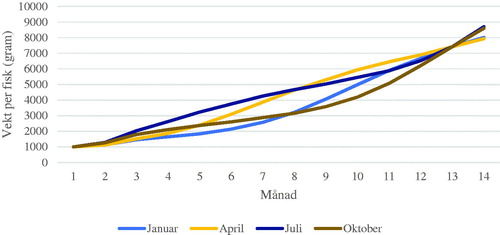
Table 15. Annual harvest with 1,000 g smolts.a
Table 16. Total costs per year and per kg 1,000-g post-smolts.
Table 17. Annual steady state production, on-growing of 100, 500 and 1,000 g smolts in open sea-pens.
Table 18. Assumptions regarding costs and losses due to delousing.
Table 19. Comparison of estimated development in weight for 100 g smolts before and after five delousings with loss of 4.5 growth days per delousing.
Table 20. Costs per delousing and cost of four generations per year in steady state.
Table 21. Production with different scenarios for delousing 100-g smolts.
Table 22. Costs per delousing and cost of four generations per year in steady state.
Table 23. Production with different scenarios for delousing, 500 g and 1,000 g smolts.Table Footnotea
Table 24. Annual steady state production cost, on-growing of 100 g, 500 g and 1,000 g smolts with delousing.
Table 25. Revenue loss due to quality downgrading: 100 g smolts with five and 10 treatments.