
Figures & data
Figure 1. Architecture of the pre-trained U-Net, where c is the number of channels, and the convolution blocks in red are the blocks inspected in this study.
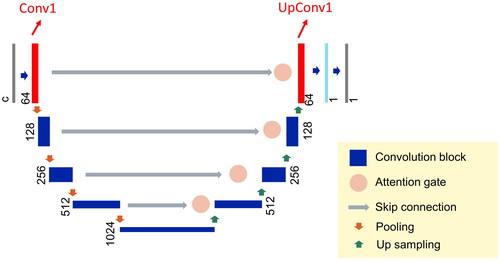
Figure 2. Analytical process using IG to explore input feature importance.
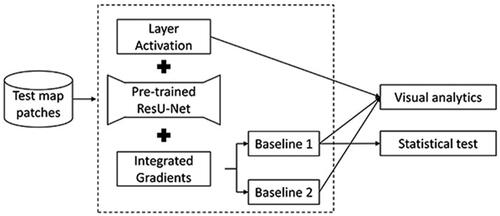
Figure 3. IG results of a test sample. (a) The white polygon is the focal building to be generalized. The gray polygons are its surrounding buildings. (b) The ground truth of the generalized building is in the red channel. The DL-predicted building is in the green channel. Thus, the yellow pixels show the true positives. (c) and (d) Raw IG values with Baseline 1. Color ramp is normalized to let the white color correspond to 0. (e) and (f) Raw IG values of Baseline 2. (g) and (h) Absolute values of IG values with Baseline 1. (i) and (j) Absolute values of IG values with Baseline 2.
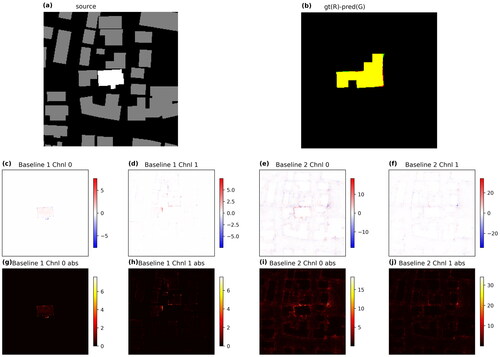
Figure 4. Layer activation of Conv1 convolution block in the trained ResU-Net with the same input as in . Numbers and letters are for reference purposes only. They are not related to their actual sequence in the layer.
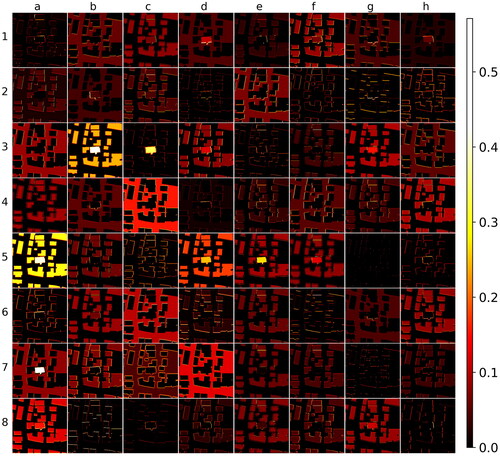
Figure 5. Enlarged layer activation of Conv1 convolution blocks (a) 4-b as in . (b) 4-d as in .
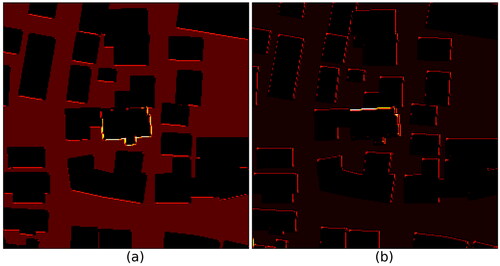
Figure 6. Layer activation of UpConv1 convolution block in the trained ResU-Net with the same input as in . Numbers and letters are for reference purposes only. They are not related to their actual sequence in the layer and have no correspondence relationship to those in .
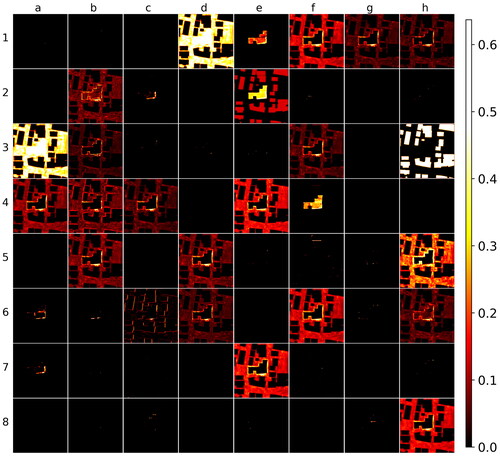
Figure 7. Histograms of the IG absolute values of the test sample in by boundary and interior pixels.
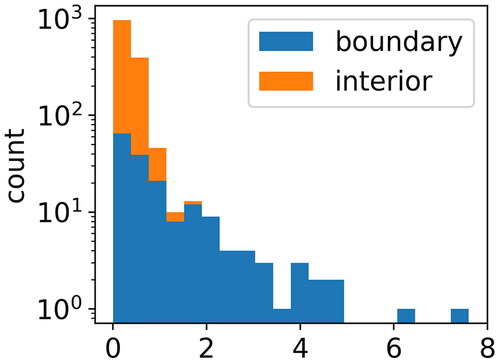
Figure 8. The five samples with p-value larger than 0.05 in .
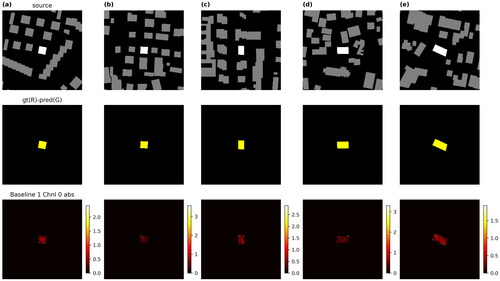
Table 1. Number of samples with corresponding p-value in the Mann-Whitney U tests.
Figure 9. (a) IoU and BIoU values of the 100 test samples. Size is defined as the number of pixels of the original building. (b) Difference between IoU and BIoU for the test samples.
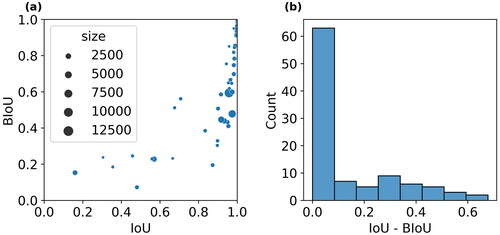
Figure 10. The top five samples with the largest difference between their IoU and BIoU values. Color scheme for channels is the same as .
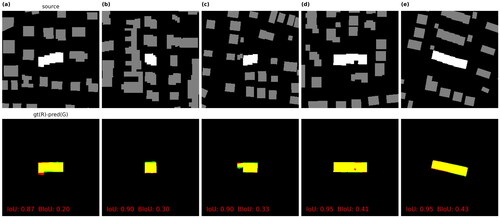
Figure 11. (a) IoU and BIoU values of the 31 samples from validation set. Size is defined as the number of pixels of the original building. (b) Difference between IoU and BIoU for the test samples.
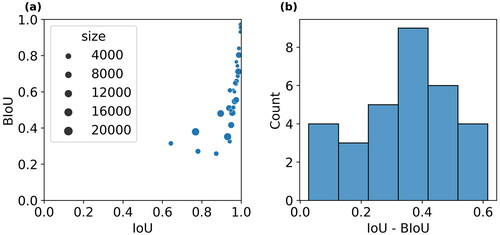
Figure 12. Selected building-with-hole samples with large differences between their IoU and BIoU values. Color schema for channels is the same as .
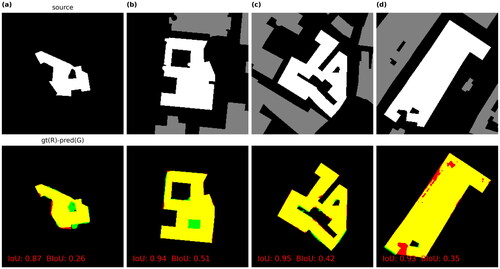
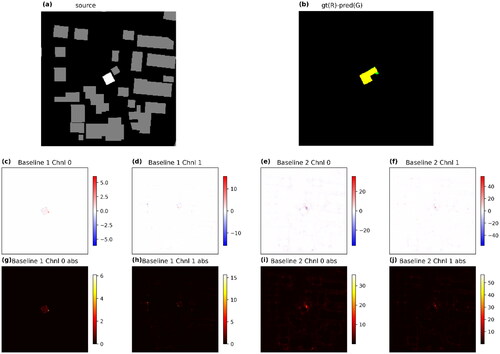
Figure A1. Additional sample of IG results. Annotations are the same as in the main text.
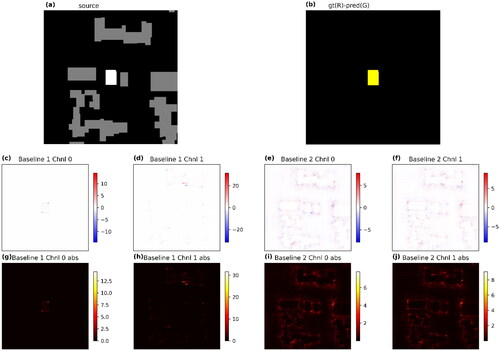
Figure A2. Additional sample of IG results. Annotations are the same as in the main text.
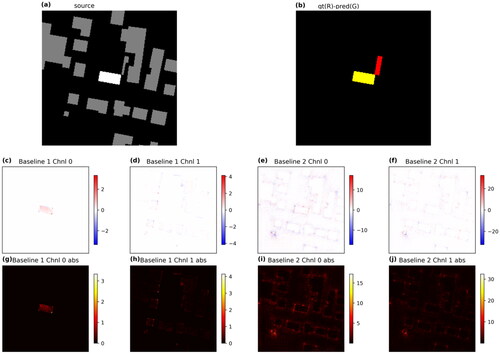
Figure A3. Additional sample of IG results. Annotations are the same as in the main text.
Data and codes availability statement
The data and code that support the findings of this study are available in ‘figshare.com’ with the identifier https://doi.org/10.6084/m9.figshare.24948057.v1.