Figures & data
Figure 1. Proportion of male and female employees who identify as part time rather than full time in each year 1996–2016.
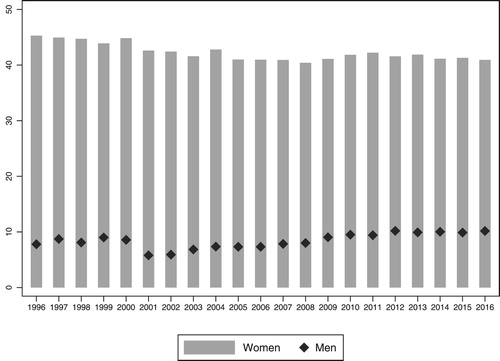
Table 1. Descriptive statistics on working hours for male and female employees based on a pooled sample of all calendar years (1996–2016).
Figure 2. Relative odds (odds ratio) of being low paid for female relative to male employees in the UK for each year 1996–2016.
Note: unadjusted odds reflect the raw effect of being female relative to male on the probability of being low paid. The adjusted odds reflect this effect after controlling for age, education, job tenure, marital status, single parent status, part-time employment, social class, contact type, sector, industry and employer size. Upper and lower bars represent confidence intervals (95%) for the estimated odds.
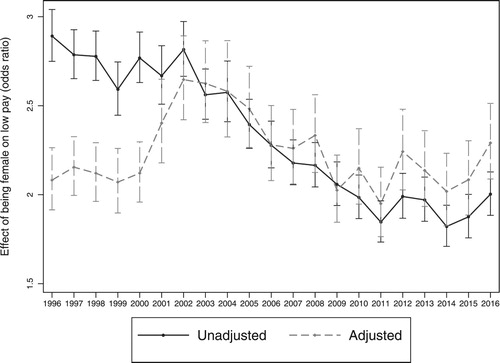
Figure 3. Results (coefficients) from a Blinder–Oaxaca decomposition of the gender gap in low pay for UK employees in 1996 and 2016.
Note: Negative coefficients indicate that women are disadvantaged relative to men in relation to each characteristic, with disadvantage here indicating a higher probability of low pay. Positive coefficients indicate that men are disadvantaged compared to women.
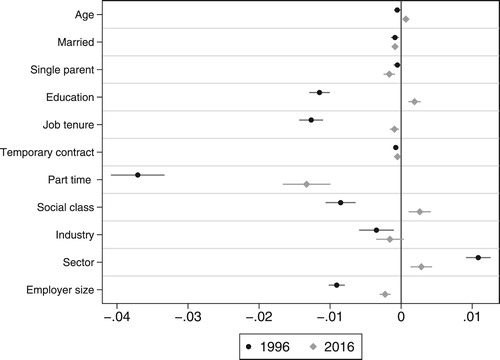
Figure 4. Results (coefficients) from a Blinder–Oaxaca decomposition of the gender gap in low pay for UK employees, 1996–2016.
Note: Negative coefficients indicate that women are disadvantaged relative to men in relation to each characteristic, with disadvantage here indicating a higher probability of low pay. Positive coefficients indicate that men are disadvantaged compared to women.
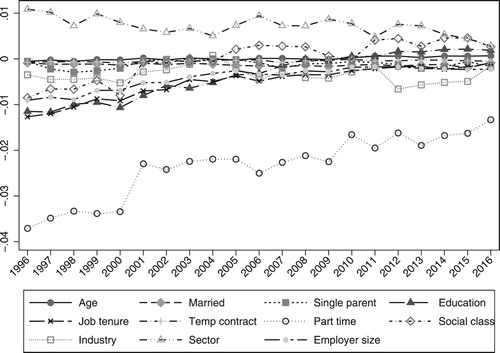
Table 2. Shift-share decomposition of the change in low pay risk for male and female employees in the UK 1996–2016.
Table A1. Variables in the analysis.
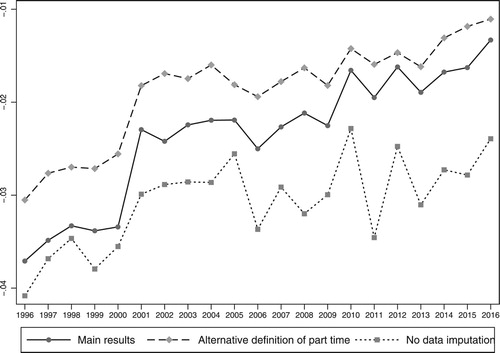
Figure A1. Robustness checks: coefficient for part-time employment from three alternative Blinder–Oaxaca decompositions of the gender gap in low pay for UK employees 1996–2016.
Note: For comparison purposes, the first set of coefficients are the results reported in the main text. The second set of coefficients are calculated using an alternative definition of part-time employment (working fewer than 30 h a week in the main job). The third set of coefficients are calculated without imputing missing data on earnings. Negative coefficients indicate that women are disadvantaged relative to men in relation to each characteristic, with disadvantage here indicating a higher probability of low pay. Positive coefficients indicate that men are disadvantaged compared to women.