
Figures & data
Figure 1. Preference of departure airport across understandability (percentages of participants).
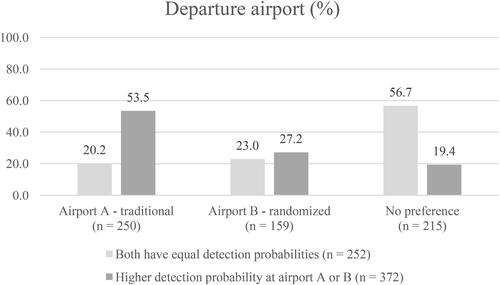
Figure 2. Preference of airport to smuggle illegal objects across understandability (percentages of participants).
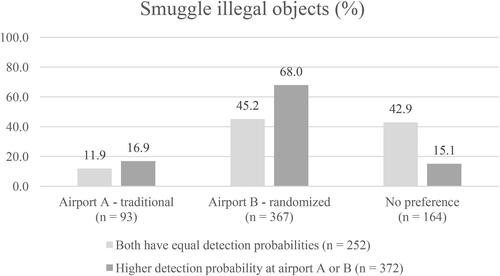
Figure 3. Mean values of the perceived likelihood of successfully smuggling illegal objects at airports A (traditional security check) and B (randomization-based security check) across understandability. The error bars represent standard errors.
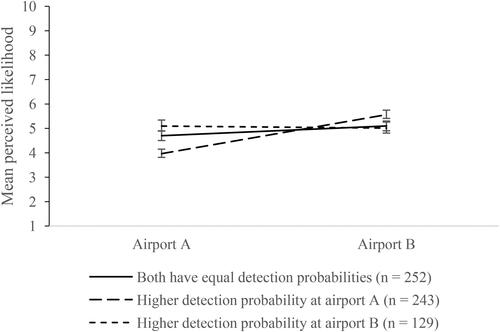
Figure 4. Mean values of the factors wait time, personnel costs, strictness, fairness, airport security and crime deterrence. X-axis represents the question “Which airport is better regarding…?”, 5-point rating scale; y-axis represents the question “How important are these factors?”, 5-point rating scale. The error bars represent confidence intervals.
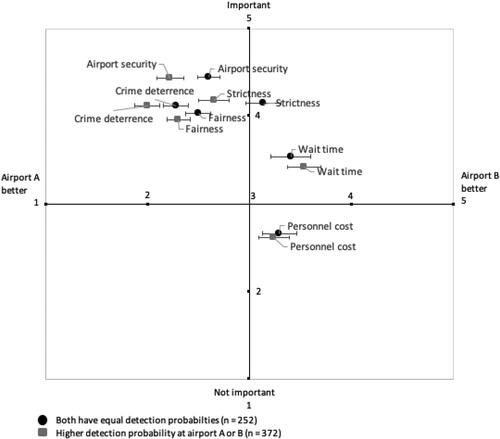
Table A1. Number of participants, row percentages - preference of departure airport.
Table A2. Number of participants, row percentages - preference of airport to smuggle illegal objects.
Table A3. Mean values, standard deviations and confidence intervals (95%) of the factors personnel costs, strictness, fairness, airport security and crime deterrence of participants.