Figures & data
Figure 1. Respondent characteristics (n = 169).
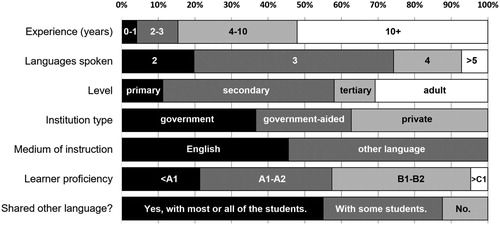
Table 1. The rural-urban continuum (n = 76). *1 = beginner; 2 = elementary/pre-intermediate; 3 = intermediate/upper intermediate; 4 = advanced.
Figure 2. Teachers’ perceptions of freedom to use other languages. Note: Percentages may not add up to 100% because of rounding.
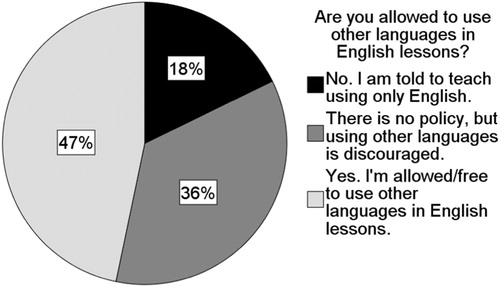
Figure 3. Freedom to use other languages by medium of instruction. Note: Percentages may not add up to 100% because of rounding.
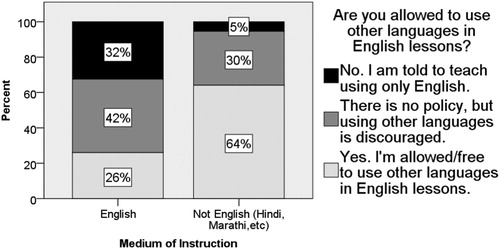
Figure 4. Freedom to use other languages by teacher experience. Notes: Only 7 respondents had 0–1 years’ experience. Percentages may not add up to 100% because of rounding.
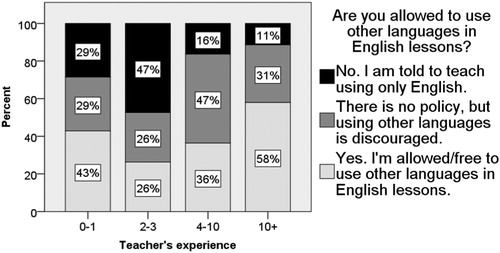
Figure 5. Translanguaging in the community. Note: Percentages may not add up to 100% because of rounding.
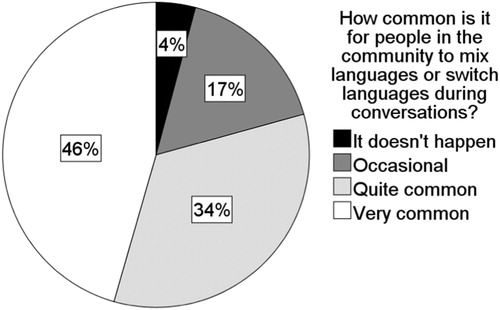
Figure 6. English in community translanguaging. Note: Percentages may not add up to 100% because of rounding.
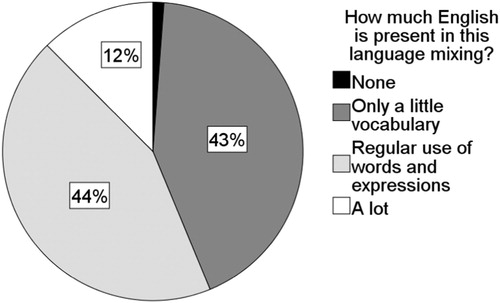
Figure 7. Respondents’ self-reported reasons for using other languages. Note: Percentages may not add up to 100% because of rounding.
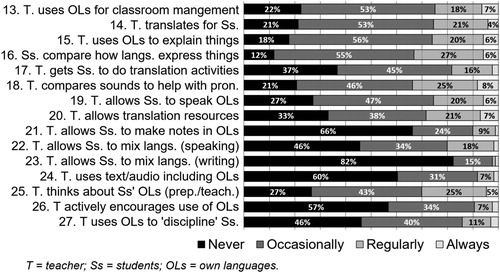
Figure 8. The four OL-use positions. Note: Percentages may not add up to 100% because of rounding.
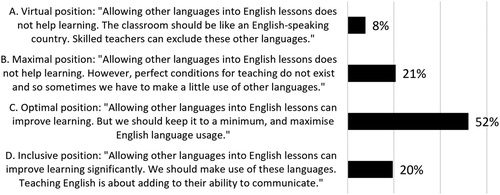
Figure 9. English teachers’ opinions on MOI in India. Note: Percentages may not add up to 100% because of rounding.
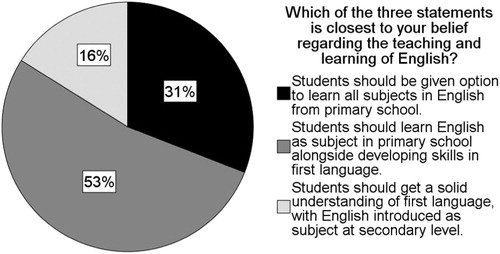
Figure 10. Teachers’ beliefs on treating languages separately by experience.
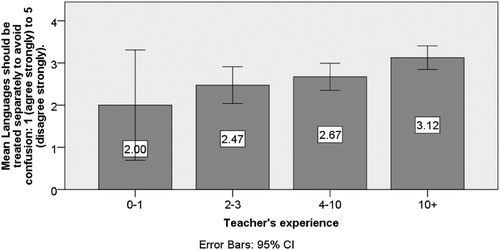
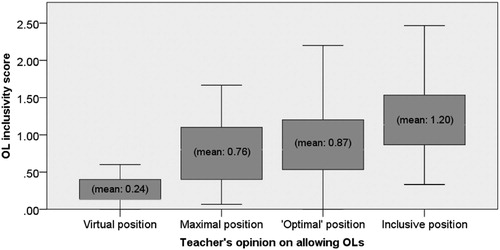
Figure 11. Teachers’ other language inclusivity scores by other language use positions.