
Figures & data
Table 1. Clinic pathological feacture of patients.
Table 2. (A) Percentages of patients showing positive immunohistochemical reactions to all the antibodies studied in normal prostate (NP), (B) benign prostatic hyperplasia (BHP), (C) prostatic carcinoma (PC); and average optical densities (O.D.) of immunostainings in positive patients, (D) statistical frequence of patients positive for antibodies under study.
Figure 1. Expression of Bcl-2 (A–D), Bcl-xL (E,F), Mcl-1 (G,H), Bax (I,J), Bim (K,L), Bad (M,N) y PUMA (O,P) in normal prostate (A,H), BPH (B,E,G,K,M,O) and prostate cancer (C,D,F,H,J,L,N,P). Scale bars: 30 μm (O,P), 25 μm (A,B,G,I,J,K) and 20 μm (C,E,F,H,L,M,N), 15 μm (D).
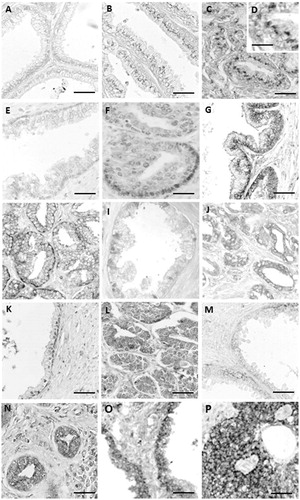
Figure 2. Expression of Noxa (A,B), p27 (C,D), pRb (E,F), mp53 (G–I) in normal prostate (G), BPH (B,D,F,I) and prostate cancer (C–F). Scale bars: 25 μm (A,D,G,H,I) and 20 μm (B,C,E,F).
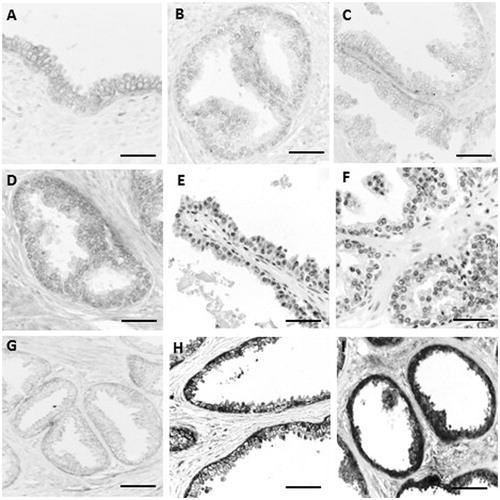
Table 3. Correlation expression of studied proteins and clinic pathological feature.
Table 4. Correlation between immunohistochemical score of studied proteins and clinic pathological feature.
Data availability
All data generated or analyzed during this study are included in this published article.