
Figures & data
Figure 1. The anxiety level of the animal was assessed via Open field and Elevated Plus Maze by comparing the time spent in the center square, peripheral square, open and closed arm, respectively. a) Time spent in the center square, b) Time spent in the peripheral square, c) Time spent in the open arm, and d) Time spent in the closed arm. *p ≤ .05 versus control group, #p ≤ .05 versus ORX group. Values represent mean ± SEM (n = 6/Group).
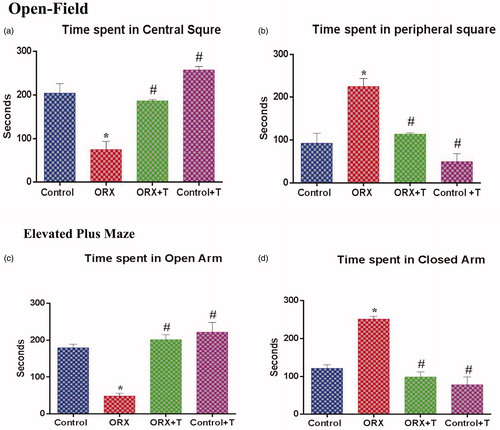
Figure 2. (a) Illustrates the lipid peroxidation level in the hippocampus of control and various experimental groups. The values are expressed in μmol of MDA formed/mg protein. (b) Graphs show the superoxide dismutase (SOD) level in control and other experimental groups. The values are expressed in units/mg of protein. (c) Depicts the catalase level in the hippocampus from various experimental groups. The values are expressed in μmol of H2O2 consumed/min/mg protein. (d) The glutathione peroxidase (GPx) level in control and other groups. The values are expressed in nmol of GSH consumed/min/mg protein. (e) Represents reduced glutathione (GSH), and values are expressed in nm/min/mg protein. f) Illustrates the glutathione-S-transferase (GST) level in the hippocampus of various experimental groups. The values are expressed in μmol of CDNB-NADPH complex formed/min/mg protein. *p ≤ .05 versus Control group, #p ≤ .05 versus ORX group. Values represent mean ± SEM (n = 6/Group).
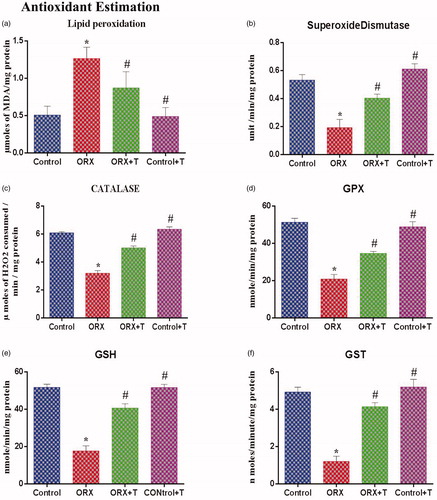
Figure 3. Image depicts H & E stained photomicrograph of CA1 (top) and CA3 (middle) subregion of the hippocampus. The green arrow shows viable cells with bright nucleus staining, and the red arrow represents the darkly stained shrunken dead cells. Magnification: 200 X. The histogram (bottom) shows the number of cells in various CA1 and CA3 subregions of the hippocampus. *p ≤ .05 versus control group, #p ≤ .05 versus ORX group. The values are expressed as no cells per cubic millimeter and represented as mean ± SEM (n = 6/Group).
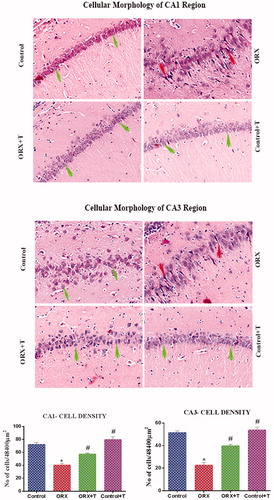
Figure 4. Photomicrograph demonstrating in situ detection of apoptotic cells by TUNEL stain in a) CA1 subregion b) CA3 sub-region of various experimental groups’ hippocampus. White arrowhead shows viable cells merged with TUNEL positive bright red cells. Magnification: 400X cells. Corresponding graphs represent the quantification of TUNEL positive cell expression and its relative percentage against DAPI expression. Data are presented as mean ± SEM (n = 6/Group).
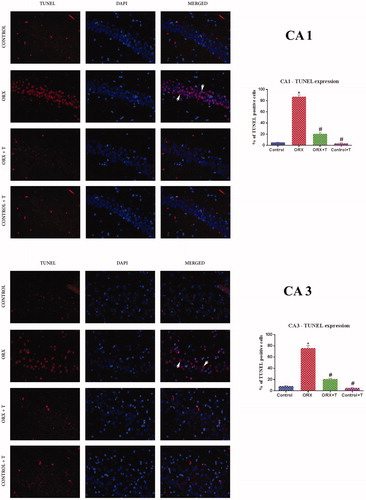
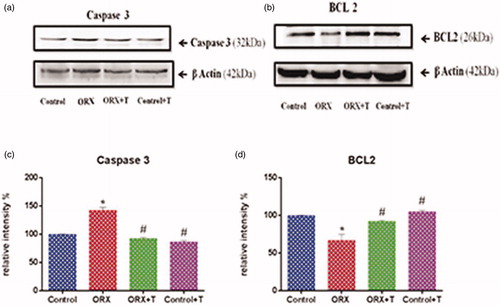
Figure 5. Shows western blot analysis of apoptotic and anti-apoptotic proteins of the hippocampus in experimental groups. Images represent western blot bands (a & b) and graphs (c & d) represents the relative intensity of protein expression. *p ≤ .05 versus control group, #p ≤ .05 versus ORX group. Values are represented as mean ± SEM (n = 6/Group).
Data availability statement
We declare that materials described in the manuscript, including all relevant raw data, will be freely available to any scientist wishing to use them for non-commercial purposes.