Figures & data
Figure 1. Experimental design. Thirty rats were distributed into 3 groups (n=10/group) - Sham group (no testicle removal), Orchiectomy group (OCX) and OCX + Testosterone replacement group (OCX+T). Orchiectomy (testicle removal) was performed on day 0 (week 1), and the testosterone administration (62.5 mg/kg body weight of Nebido) was performed in two moments: 30 and 60 days after orchiectomy. The testicles of the animals in sham groups were exposed and manipulated, but not removed. The rats were euthanized on day 77, when completed 11 weeks.
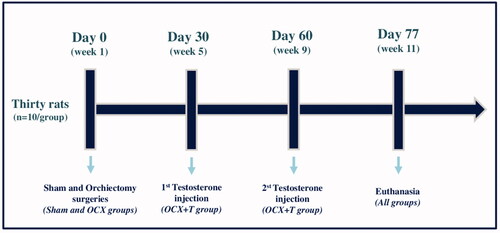
Figure 2. Serum testosterone concentration. The animals in all groups showed a similar testosterone level on day 0 (week 1). After 77 days (weel 11), orchiectomy (OCX) and testosterone treatment (OCX+T) promoted, respectively, the complete depletion and physiological replacement of hormone (chart A). Over time, as showed in the chart B, the testosterone level remained at physiological levels in both Sham and OCX+T groups, although the higher concentrations in the animals that received exogenous testosterone, meanwhile the hormone concentration was completed reduced by OCX during the time. Chart A - *P < 0.05 when compared to the respective group on day 0 (week 1), **P < 0.05 between groups on day 77 (week 11). Chart B - Different letters indicate statistical difference between the groups (Sham, OCX, OCX+T) in the same timepoint, and identical letters show no difference; Asterisks indicate statistical difference within a group over time. ***P<0.05 in comparison to the timepoint of 48hrs post-2nd testosterone replacement. Data are shown as mean ± SEM. Sham - No testicle removal.
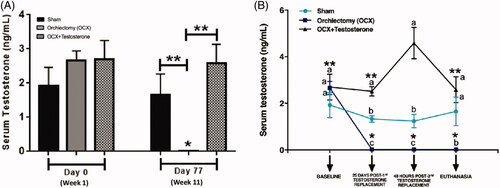
Figure 3. Microcomputed tomographic evaluation of femoral bone. The microarchitecture parameters of trabecular (Panel A) and cortical bone (Panel B) evaluated were bone volume fraction (BV/T V, %), Trabecular thickness (Tb.Th), Trabecular number (Tb.N), Trabecular separation (Tb.S), Trabecular and Cortical Connectivity density (Conn.D), Cortical thickness (C.Th), Cortical Total porosity (Po.tot) and bone mineral density (BMD). The 3D reconstructed images of femurs are representative of each group and illustrate the results of the graphs. Data are shown as mean ± SEM. The bars represent the average, while the vertical lines indicate the standard deviation. *p<0.05 compared to the sham group. Sham - no testicle removal.
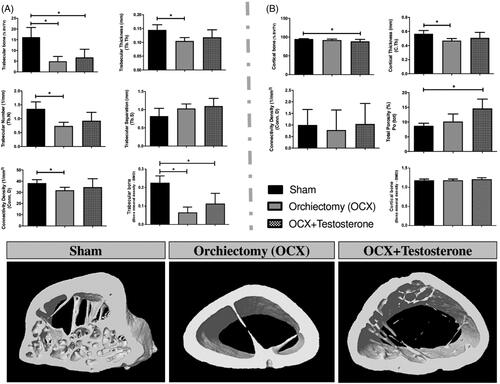
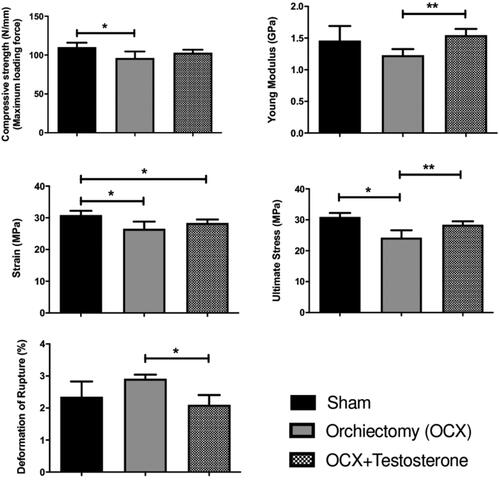
Figure 4. Biomechanical evaluation of femurs on day 77 (week 11). The biomechanical evaluation was performed using the MT S 810 mechanical test machine by a three-point bending testing and the mechanical parameters evaluated were the compressive strength (maximum load force - N/mm), young modulus (GPa), strain (MPa), ultimate stress (MPa) and deformation of rupture (%). Testosterone administration prevented the reduction of femoral bone strength promoted by castration. Data are shown as mean ± SEM. The bars represent average, while vertical lines indicate the standard deviation. *P<0.05 compared to the sham group; **P<0.05 compared to the orchiectomy group. Sham - no testicle removal.