Figures & data
Table 1. Comparison of clinical and biochemical data of patients presenting for symptoms of hypogonadism or infertility.
Figure 1. Distribution of cases according to levels of TT and cFT. TT = total testosterone; cFT = calculated free testosterone. The patients are classified in six classes based on low, borderline, normal total testosterone concentrations and low or normal free testosterone concentrations.
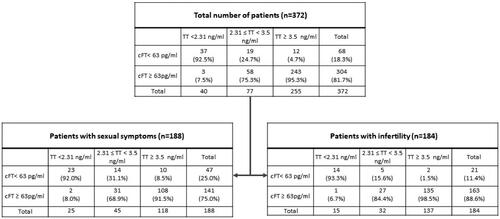
Table 2. Type of hypogonadism based on LH and cFT.
Table 3. Pearson’s correlations of TT/cFT with different variables.
Table 4. Comparison between patients with low/normal cFT and with low/borderline/normal TT levels.
Table 5. Binary linear logistic regression on the factors associated with low testosterone. Singificant data are in bold.
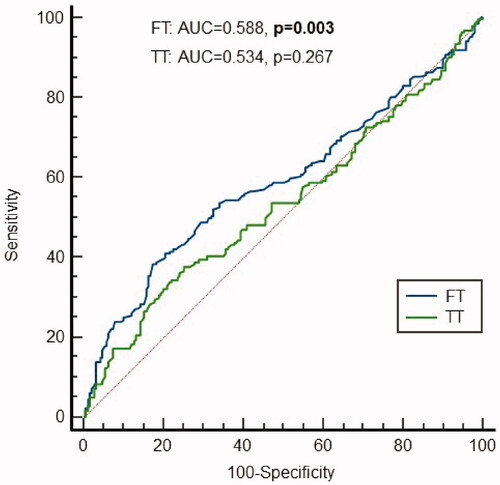
Figure 2. ROC curve of cFT and TT values predictive of sexual symptoms. Analysis of the accuracy of free testosterone and total testosterone in the diagnosis of sexual symptoms.