
Figures & data
Figure 1. Visual rendition of the protocol to realise the networks of images later analysed.
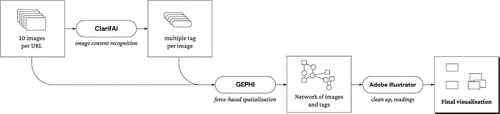
Figure 2. Visuals on the debate (all the images used by actors, 2018). The network is clustering the images per theme/content.
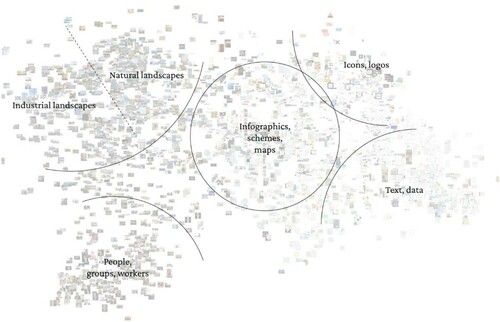
Figure 3. Visuals on the debate (all the images used by actors, 2019). The network clusters the images per theme/content.
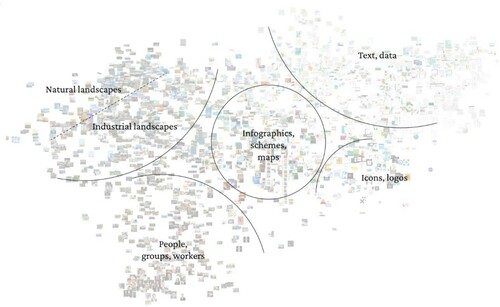
Figure 4. Visual network of shale gas controversy in 2018, per country. The colour of the images converted to dots represents the positioning of the actor on the debate. The place of the dot in the network represents the type of cluster the image belongs to (see ).
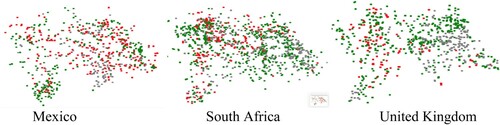
Figure 5. Visual network of shale gas controversy in 2019 per country. The colour of the images converted to dots represents the positioning of the actor on the debate. The place of the dot in the network represents the type of cluster the image belongs to (See ).
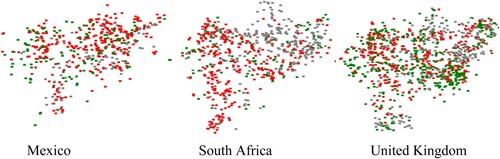
Table 1. Images retrieved per year/country, according to the actor’s position.