
Figures & data
Figure 1. Cost-consequence model schematic. Abbreviations. COVID-19: coronavirus disease 2019; MV, mechanical ventilation.
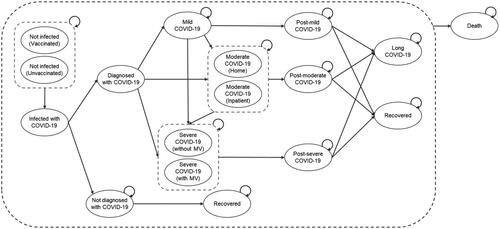
Table 1. COVID-19 testing, disease severity, and symptomsCitation27.
Table 2. Model inputs.
Table 3. Total cost saving and cost saving per person receiving RD-X19.
Figure 2. Deterministic and probabilistic sensitivity analyses by state. Abbreviation. MV, mechanical ventilation.
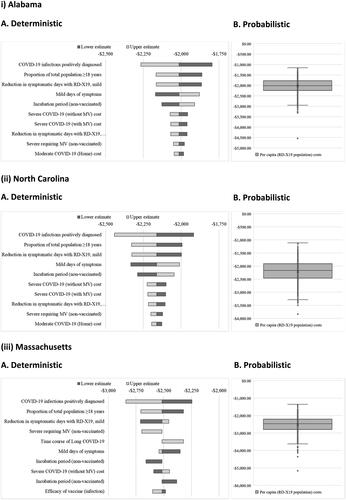
Figure 3. Number of cases by severity prevented by state as a function of RD-X19 clinical benefit.
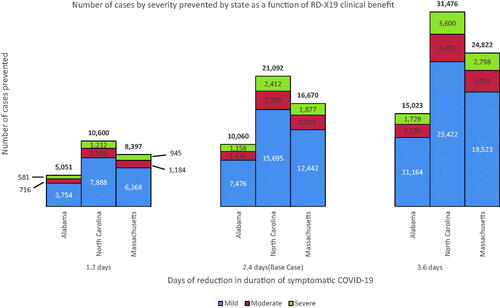
Table 4. Lives saved and cases reduced as a function of efficacy and date of introduction of RD-X19 (base case with 10% penetration).
Supplemental material