Figures & data
Table 1. Participant demographics and baseline characteristics (MITT population).
Figure 1. Least-squares mean change in the severity of vaginal dryness from baseline to week 12 in the MITT population. *p < 0.05, †p < 0.01, ‡p < 0.001, §p < 0.0001 versus placebo. LS, least squares; MITT, modified intent-to-treat; SE, standard error.
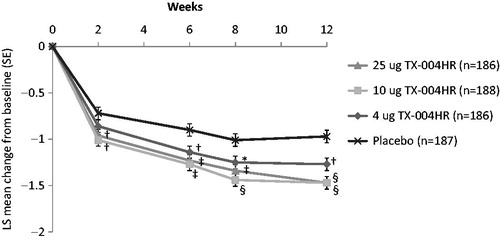
Figure 2. Percentage of women who had substantial improvements (two levels or more) in severity of (A) dyspareunia and (B) vaginal dryness over 12 weeks. *p < 0.05, †p < 0.01, ‡p < 0.001 versus placebo in women with moderate to severe vaginal symptoms.
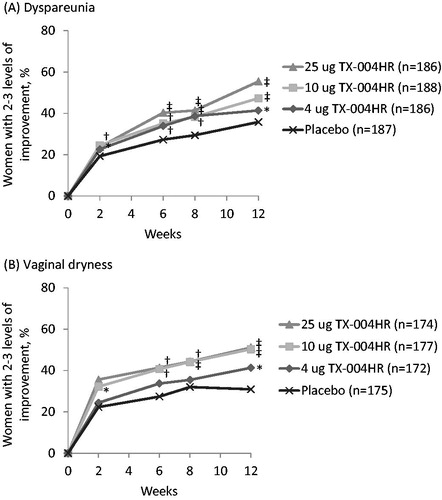
Figure 3. Percentage of women with at least one level of improvement from baseline in dyspareunia, vaginal dryness, or both at week 12. Women with missing data or who did not have vaginal penetration were not included in the calculation. *p < 0.05, †p < 0.01 versus placebo.
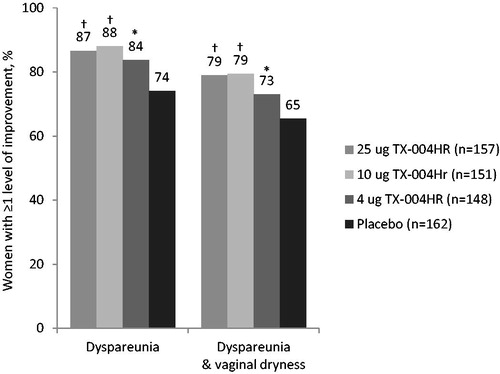
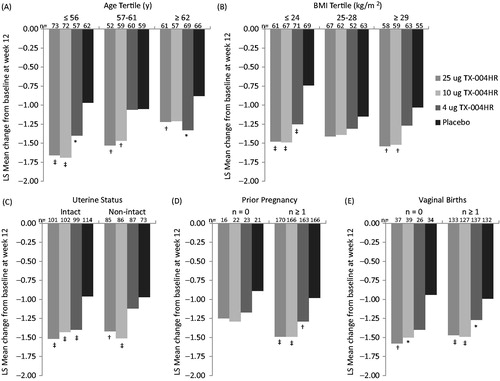
Figure 4. Least-squares mean change in vaginal dryness score from baseline to week 12 by (A) age, (B) BMI, (C) uterine status, (D) prior pregnancy, and (E) number of vaginal births. *p < 0.05, †p < 0.01, ‡p < 0.001 versus placebo. BMI, body mass index; LS, least squares; y, years.