
Figures & data
Table 1. Patients’ demographics and baseline characteristics (N = 40).
Figure 1. Effect of Hydeal-D vaginal pessaries on the Vaginal Health Index (VHI) of postmenopausal women. VHI scores, expressed as mean ± standard deviation (SD), evaluated in 40 patients at screening, at baseline, and at 1 and 3 months of treatment are presented. Significance levels were calculated at 1 and 3 months of treatment compared to baseline (***p < 0.0001, signed-rank test) and confirmed by repeated-measures analysis of variance. VVA, vulvovaginal atrophy.
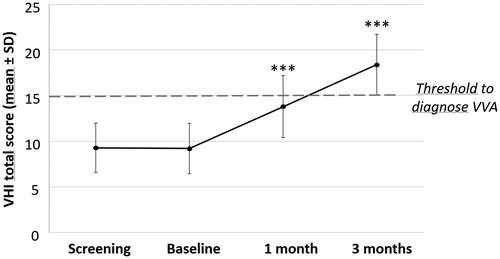
Figure 2. Significant decrease in vaginal pH in postmenopausal women treated with Hydeal-D vaginal pessaries. Vaginal pH changes were assessed in 40 postmenopausal women at screening, at baseline, and after 1 or 3 months of treatment with Hydeal-D. The percentage of patients in four different pH subgroups at all visits is reported. Significance levels were calculated by signed-rank test at 1 and 3 months compared to baseline. Differences were considered significant with p < 0.05. ***p < 0.0001.
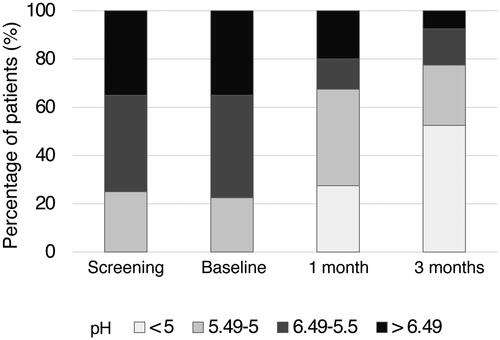
Table 2. Summary statistics for the total score of patients’ perception of vulvovaginal symptoms (N = 40).
Table 3. Single symptom score change of patients' perception of vulvovaginal symptoms (N = 40).