
Figures & data
Figure 1. Mean visual analog scale (VAS) score over time for the two treatment groups. Vaginal erbium laser (VEL) group and VEL + Nd:YAG group VAS scores were compared using the post-hoc test with Bonferroni correction. *p < 0.001 versus T0 of VEL group. **p < 0.001 versus T0 of VEL + Nd:YAG group. §p < 0.001 versus corresponding time of VEL group. L1, L2, L3, laser applications; T0 (baseline), 2–4 weeks prior to first laser treatment; T1, 1 month from last laser application; T3, 3 months from last laser application; VEL + Nd:YAG, neodymium:yttrium–aluminum–garnet.
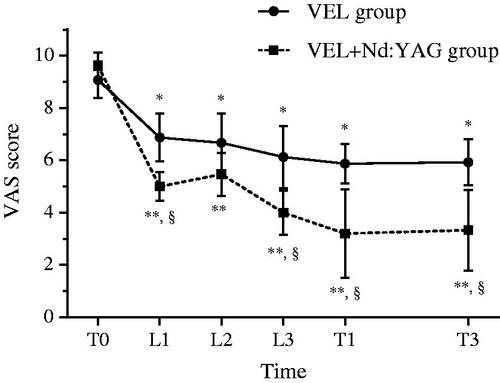
Table 1. Characteristics of overall trend of means observed in the two groups.
Table 2. Results of multiple linear regression model of the difference between VAS score at T0 and at T3 (ΔT0/T3) corrected for age during treatment, YSM and treatment performed.