Figures & data
Table 1. Baseline demographics and clinical characteristics of the population.
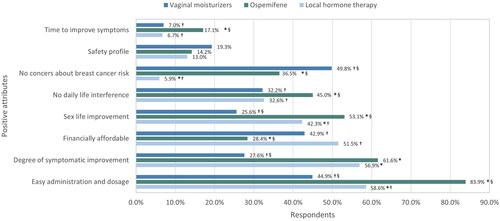
Figure 1. Satisfaction ratings of the different vulvovaginal atrophy therapy formulations. All differences were statistically significant (p < 0.0001). Bars represent the standard deviation from the mean.
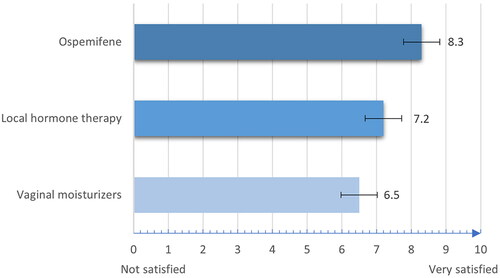
Table 2. Responses provided by surveyed women on medication adherence.
Figure 2. Positive attributes selected by surveyed women on the different vulvovaginal atrophy therapy formulations. *p < 0.05 vs. vaginal moisturizers. †p < 0.05 vs. ospemifene. §p < 0.05 vs. local hormone therapy.