
Figures & data
Table 1. Demographic characteristics.
Table 2. Intercorrelations, means and standard deviations for demographic variables, depressive symptoms and self-compassion.
Figure 1. Cross-lagged model of self-compassion and depressive symptoms. Coefficients are standardized β values. * p < 0.05. ** p < 0.01. *** p < 0.001. T1, baseline; T2, after 5 years.
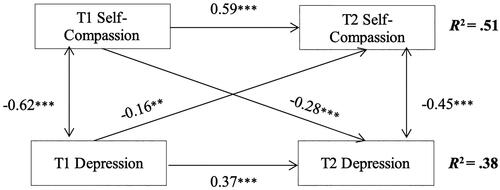
Table 3. Autoregressive and cross-lagged effects for self-compassion and depressive symptoms.
Data availability statement
This dataset is not publicly available as the data are currently being used by the authors for ongoing projects.