
Figures & data
Table 1. Perpetrator’s use of violence vs. protector’s use of military force.
Table 2. Outcome calibrations with fuzzy scores, qualitative descriptions, number of cases and case IDs from UNPOCO.
Table 3. Troop-to-population ratio calibrations with fuzzy scores, descriptions, number of cases, ratio thresholds and case IDs from UNPOCO.
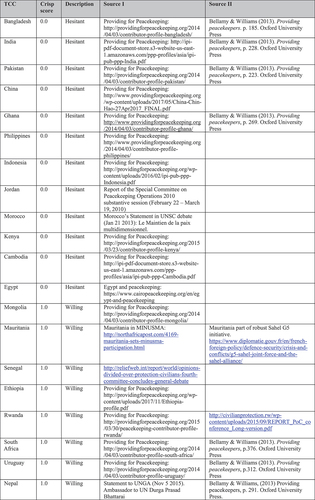
Table 4. Calibration of TCCs' willingness to accept risk.
Table 5. Calibration of TCC's willingness to accept risk, including constallations of willing/hesitant TCCS, fuzzy scores, description, number of cases, and case IDs.
Table 6. Calibration of the pre-emptive/reactive character of UN military protection operations, including fuzzy scores, description, number of cases and case IDs from UNPOCO.
Table 7. Calibration of UN troops’ ability to match the perpetrators by force, including fuzzy scores, description, number of cases and case IDs from UNPOCO.
Table 8. Analysis of necessary conditions for the presence of positive outcomes.
Figure 1. Venn-diagrams portraying the logic of a trivial (1) and non-trivial (2) necessary condition.
Table 9. Relevant rows from the truth table derived from the analysis of the QCA matrix.
Table 10. Intermediate solution analysis of the truth table derived from the QCA matrix.
Data availability statement
The data that support the findings of this study are openly available in DataverseNO at https://doi.org/10.18710/FZAVCN, United Nations Protection of Civilians Operations dataset (UNPOCO), V1.