Figures & data
Table 1. Overview of country-specific characteristics for each country (N = 31).
Table 2. Descriptive statistics of all variables analysed.
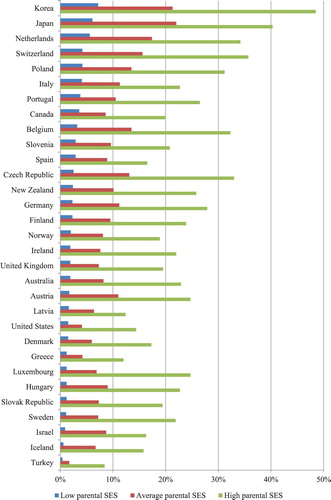
Figure 1. The percentage of top-performing students in reading within each category of parental SES (N = 31).
Source: PISA 2015.
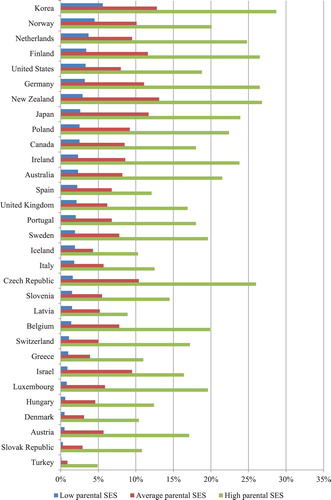
Figure 2. The percentage of top-performing students in mathematics within each category of parental SES (N = 31).
Source: PISA 2015.