
Figures & data
Figure 1. Schematic representation of the chronological order of events in the study design and data collection.
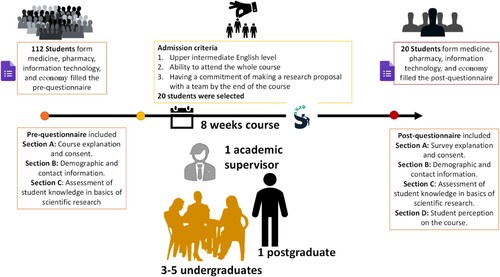
Table 1. Demographic information of participants in the PL process (undergraduate students).
Table 2. Student’s perception towards the academic research skills and self esteem after the PL process using Likert scale questions where, 1 = strongly disagree, 2 = disagree, 3 = neutral, 4 = agree, 5 = strongly agree.
Figure 2. Student’s perception on skills improved and/or developed during the PL process (N = 20).
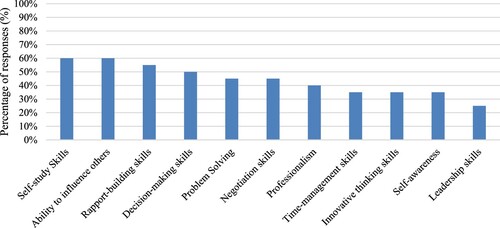
Table 3. Student’s perception on extra skills improved and/or developed during Peer learning process.
Table 4. Examples of students’ positive and negative comments towards peer learning process.
Table 5. Assessment of students understanding of academic research concepts and basics before and after the workshop.