Figures & data
Table 1. Sociodemographic characteristics of the patients included (n = 18,119).
Table 2. Clinical characteristics of the patients included (n = 18,119).
Table 3. Adherence to non-insulin glucose-lowering drugs (GLDs, overall and by treatment).
Table 4. Association between adherence to non-insulin GLDs (glucose-lowering drugs, overall and by type of drug) and HbA1c response after one year (multiple imputations for covariables*).
Table 5. Association between adherence and patient characteristics (predictors retained in the final multivariate logistic regression model).
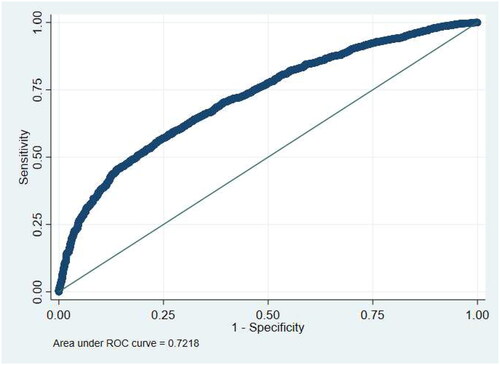
Figure 1. Receiver-operating characteristic curve showing the discrimination between adherent (MPR >80%) and non-adherent (MPR ≤80%) patients for the index GLD when using predicted values from the full logistic regression model*. MPR: medication possession ratio. *Validation statistics: R squared (higher values indicate better discrimination) = 0.222 (95%CI = 0.186–0.258); ROC statistic (higher values indicate better discrimination) = 0.728 (95%CI = 0.706–0.737); Brier score (lower values indicate better performance) = 0.177 (95%CI = 0.171–0.183)