Figures & data
Table 1. Different possible authority configurations
Figure 1. De jure authority compared with de facto expert authority (Hooghe et al. 2017)
Figure 2. De jure expert authority compared with de facto expert authority (Zürn et al. Citation2020)
Table 2. Different observed authority configurations IPA level
Figure 3. De jure expert authority and de facto expert authority in agriculture (agribusiness (AB), biodiversity (BD), bioenergy (BE) and agricultural policies on climate change (CC))
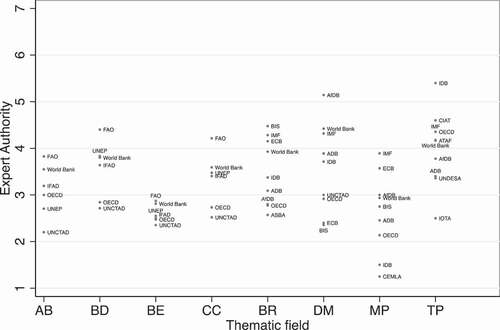
Figure 4. De jure expert authority and de facto expert authority in finance (banking regulation (BR), debt management (DM), monetary policy (MP) and tax policy (TP))
Table 3. Different observed authority configurations IPA and policy level
Figure 5. De jure expert authority and de facto expert authority distribution of addressees (labels indicate the percentage of respondents per IPA)
Table 4. Different observed authority configurations at the addressee level (national bureaucratic unit)
Table A1. IPAs included in the survey in the different policy areas
Table A2. Question on expert authority in the survey
Table A3 Response rate (based on n = 354)
Figure A1. Work experience (thematic field)
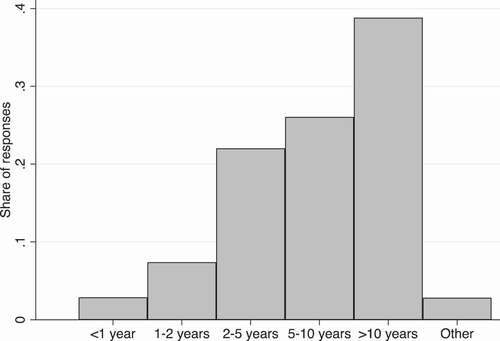
Figure A2. Work experience (thematic field in administrative unit)
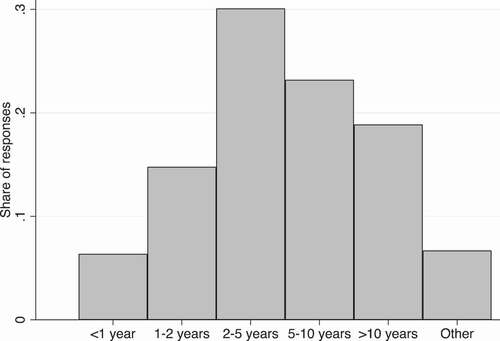
Figure A3. Staff category
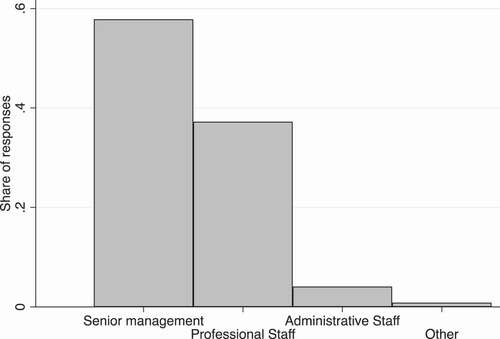
Figure A4. Distribution of evaluations of expert authority
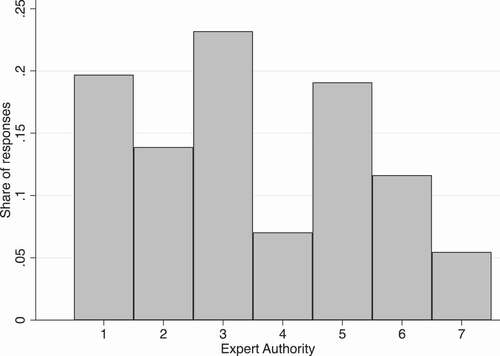
Figure A5. Average by IPA in each policy area (full sample).