Figures & data
Table 1. Polyphenol composition identified in methanol extract of BP using LCMS.
Table 2. Soluble concentration, polyphenol content and antioxidant activity of BP extracts.
Figure 1. Area of the electron paramagnetic resonance (EPR) spectra of the radical adduct DMPO-OCH3 generated from a solution of H2O2 [2 mM] and FeSO4 [0.04 mM] with DMPO [14 mM] as spin trap in MeOH as solvent. The area of the EPR signal is plotted against concentration of BP methanolic extracts.
![Figure 1. Area of the electron paramagnetic resonance (EPR) spectra of the radical adduct DMPO-OCH3 generated from a solution of H2O2 [2 mM] and FeSO4 [0.04 mM] with DMPO [14 mM] as spin trap in MeOH as solvent. The area of the EPR signal is plotted against concentration of BP methanolic extracts.](/cms/asset/e7d017e6-a110-479e-b467-cba8327c90a5/iphb_a_1282528_f0001_b.jpg)
Table 3. The colour values of beef patties during refrigerated storage for 10 days.
Figure 2. Effects of BP extract and BHT on metmyoglobin changes in beef patties during 10 days of refrigerated storage at 4 °C.
Control = beef patty without antioxidants, 0.1% BHT = beef patty with 0.1% (w/w) of butylated hydroxytoluene, BP (0.1%) = beef patty with 0.1% (w/w) of BP extract, BP (0.3%) = beef patty with 0.3% (w/w) of BP extract. Each sample was measured in triplicate and the average standard deviation for each sample was less than 5%.
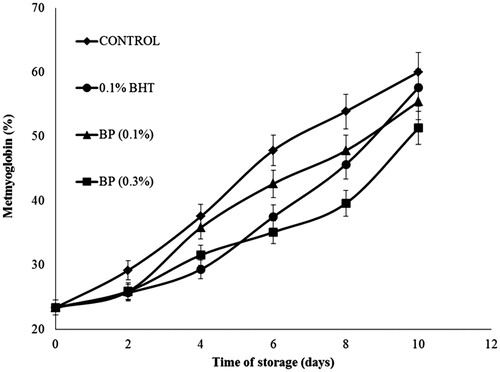
Figure 3. The TBARS values (mg malondialdehyde/kg sample) of beef patties in MAP atmosphere during refrigerated storage for 10 days without light.
Control = beef patty without antioxidants, 0.1% BHT = beef patty with 0.1% (w/w) of butylated hydroxytoluene, 0.1% BP = beef patty with 0.1% (w/w) of BP extract, 0.3% BP = beef patty with 0.3% (w/w) of BP extract. Each sample was measured in triplicate and the average standard deviation for each sample was less than 5%.
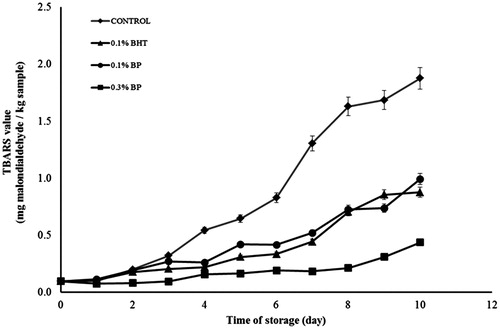
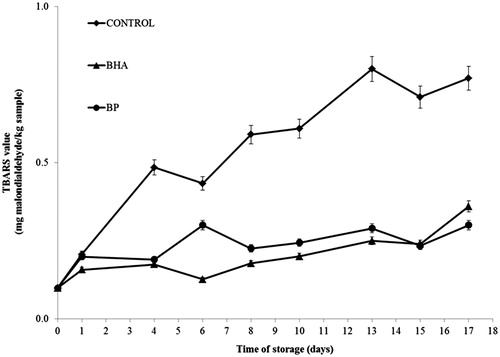
Figure 4. Changes in TBARS values (mg malodialdehyde/kg sample) in control and sample containing 0.1% (w/w) BHT and BP extract in MAP atmosphere during 17 days storages at 4 ± 1 °C without light. Each sample was measured in triplicate and the average standard deviation for each sample was less than 5%.