Figures & data
Table 1. Average monthly temperature (T), day length (DL) and visible light length (LVL) in Laghouat and Ain-oussera during 2010.
Figure 1. Monthly variation in the total phenolic contents.
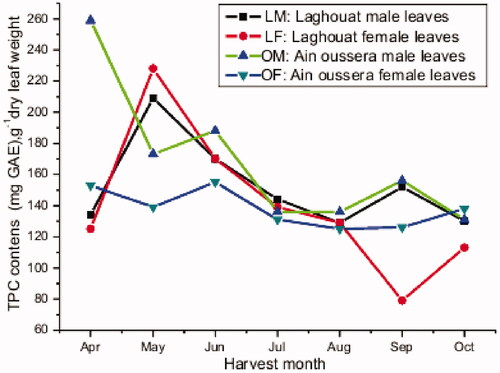
Table 2. Total phenolic contents in P. atlantica leaves harvested in different months from Laghouat and Ain oussera regions, expressed as mg gallic acid quivalents (mg GAE)/g dry leaf weight.
Figure 2. Monthly variation in the flavonoid content.
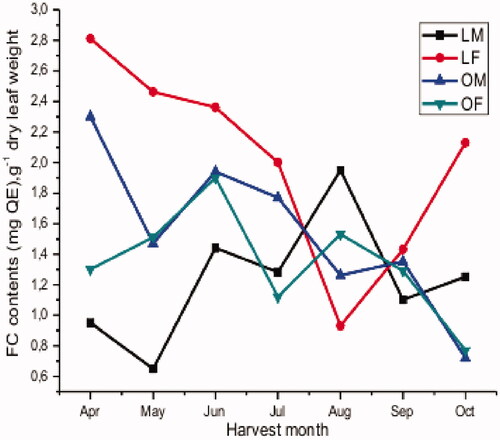
Table 3. Flavonoid content in P. atlantica leaves, harvested in different months from Laghouat and Ain oussera regions, expressed as mg quercetin equivalents (mg QE)/g dry leaf weight.
Figure 3. Monthly variation in condensed tannins content.
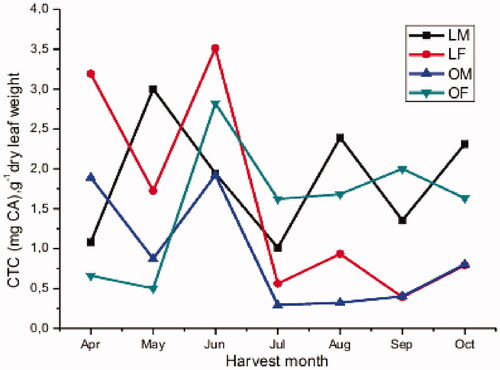
Table 4. Condensed tannin contents in P. atlantica leaves, harvested in different months from Laghouat and Ain oussera regions, expressed as mg catechin equivalents (mg CAE)/g dry leaf weight.
Figure 4. Monthly variation in the DPPH scavenging activity.
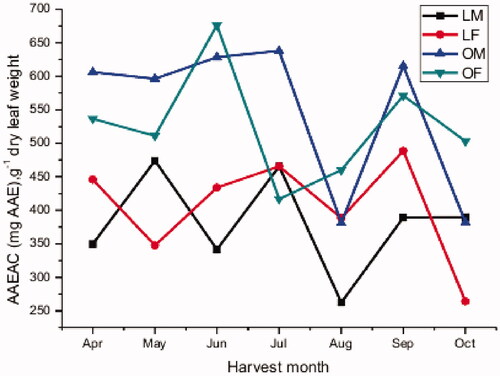
Table 5. The monthly variation in the DPPH scavenging activity in P. atlantica leaves which were collected in Laghouat and Ain oussera regions, expressed as mg ascorbic acid equivalent (mg AAE)/g dry leaf weight.
Figure 5. Monthly variation in the reducing power capacity.
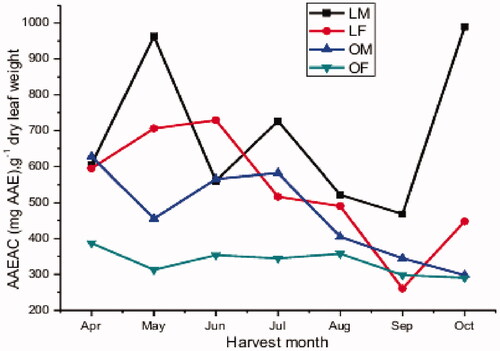
Table 6. The monthly variation in reducing power activity in P. atlantica leaves collected in Laghouat and Ain oussera regions, expressed as mg ascorbic acid equivalent (mg AAE)/g dry leaf weight.
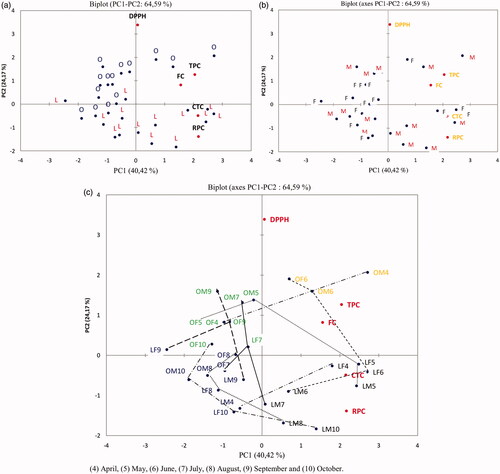
Figure 6. PC1-PC2 loading plot after autoscaling of the variables TPC, FC, CTC, DPPH and RPC.
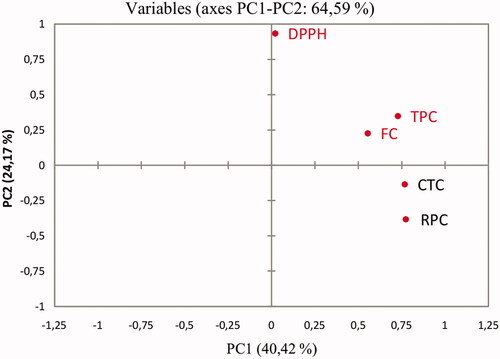
Figure 7. PC1-PC2 biplot, showing 28 P. atlantica samples labeled according to (a) harvest regions, (b) the genders, and (c) the harvest months.