Figures & data
Figure 1. (a) Stomach of rat treated with okra 500; (b) Stomach of rat treated with okra 250; (c) Stomach of rat treated with okra 100; (d) Stomach of rat treated with Fam 20; (e) Stomach of rat treated with Que 75; and (f) Stomach of rat treated with ethanol (80%).
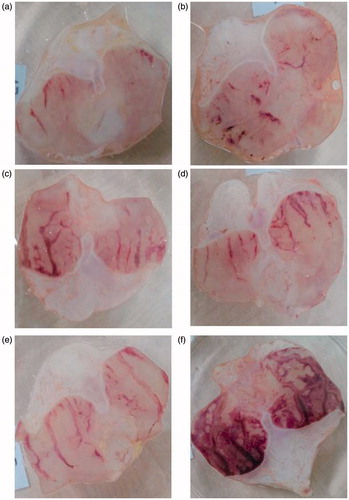
Table 1. Ulcer index and the % ulcer inhibition levels in study groups.
Table 2. The levels (mean ± SD) of malondialdehyde (MDA) and reduced glutathione (GSH) in whole blood in study groups.
Table 3. The levels (mean ± SD) of ascorbic acid, β-carotene and retinol in serum in study groups.
Figure 2. TUNEL assay. Nearly normal mucosa and minimal TUNEL positive cells were observed (a and b). TUNEL positive cells were observed in the intensive ethanol group (f), in the okra 100, Fam 20 and Que 75 and groups moderate amount of TUNEL-positive density was detected (c, d and e, respectively). (a) okra 500; (b) okra 250; (c) okra 100; (d) Fam 20; (e) Que 75 and (f) Ethanol groups. Arrows: TUNEL positive cells. Magnifications: 200×.
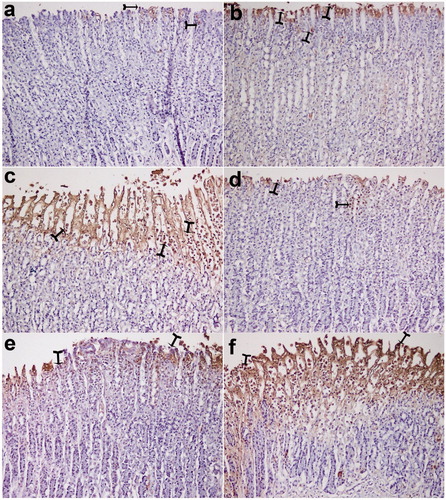
Figure 3. TUNEL positive cells distribution. TUNEL positive cell counts was higher in the ethanol group, but decreased significantly in the treatment group. *: p < 0.001; Compared with ethanol group; **: p < 0.05 Compared with ethanol group. One-way ANOVA and Tukey’s post test.
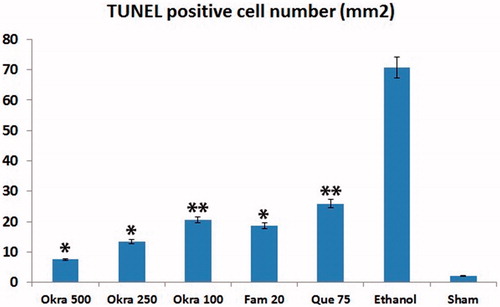
Figure 4. PCNA staining. The number of PCNA-positive cells in the intense okra 500 group (except sham); at least the group was determined in ethanol. (a) okra 500; (b) okra 250; (c) okra 100; (d) Fam 20; (e) Que 75 and (f) Ethanol groups. Arrows: PCNA positive cells. Magnifications: 200×.
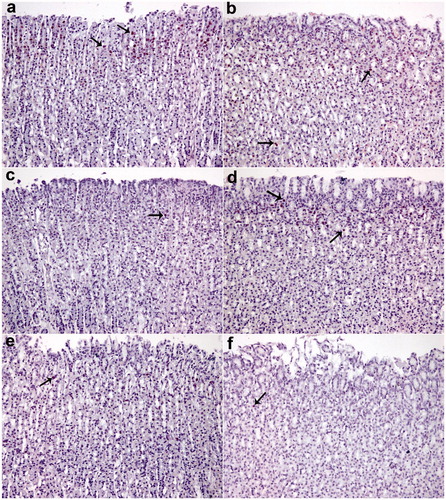
Figure 5. PCNA positive cells distribution. PCNA positive cell density less ethanol group; particularly in okra 500 group it was significantly increased in all treatment groups. *: p < 0.001; Compared with ethanol group; **: p < 0.05 Compared with ethanol group. One-way ANOVA and Tukey?s post test.
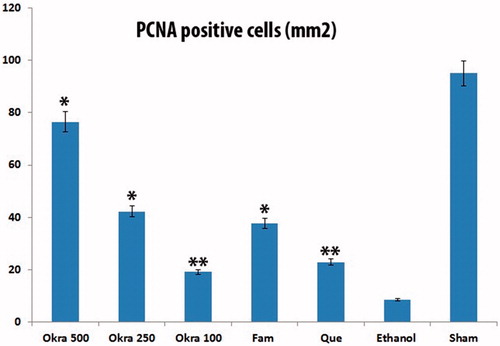
Figure 6. Histological appearance of gastric mucosa. Nearly normal mucosa view, okra 500 (a) and okra 250 (b); Hemorrhage, epithelial ulceration and very edema okra 100 (c); Decreases ulceration, hemorrhage and inflammation (d) Fam 20 and (e) Que 75 groups; Very epithelial ulceration, hemorrhage, inflammation and edema (f) Ethanol group. (H&E; Magnifications: 200×). Thin Arrows: epithelial ulceration; arrow-heads: Hemorrhage; Thick arrows: Inflammatory cells.
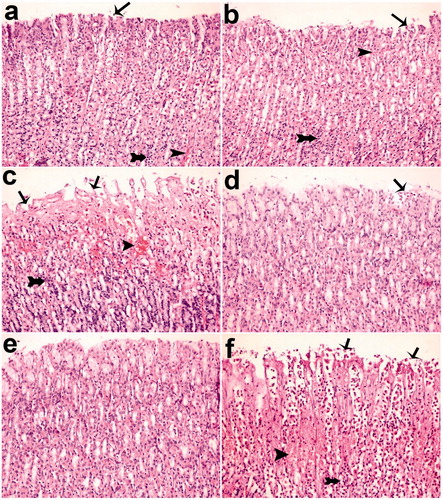
Table 4. The effect levels of Okra 100, 250, 500 mg/kg, Fam 20 mg/kg and Que 75 mg/kg in gastric mucosa induce by ethanol in rats.
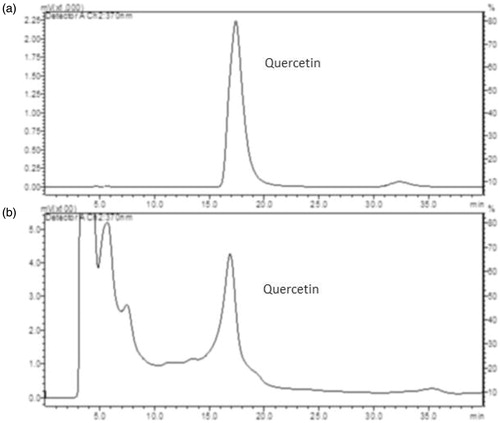
Figure 7. (a) HPLC choromatographic separation of quercetin standard. (b) Separation of quercetin in okra hydroalcoholic extract. For chromatographic conditions, see experimental procedures.