
Figures & data
Table 1. PCR primers and RT-PCR cycles for the key genes associated to hyperuricaemia.
Table 2. Effects of PCE and PCW on SUA, UUA, BUN and SCr levels and ALT, AST and ALP activities.
Table 3. Body weights of mice on the 1st and 7th days (a) and the organ coefficients of liver (b), kidney (c), spleen (d) and thymus (e) on 7th day.
Figure 1. Histological micrographs of liver tissues stained with H&E: normal control, hyperuricemic control, allopurinol control (5 mg/kg), benzbromarzone control (7.8 mg/kg), PCE (50 mg/kg), PCE (100 mg/kg), PCE (200 mg/kg), PCW (50 mg/kg), PCW (100 mg/kg) and PCW (200 mg/kg). Magnification, ×200 ×; scale bar, 100 μm; red arrow, necrotic and/or inflammatory foci.
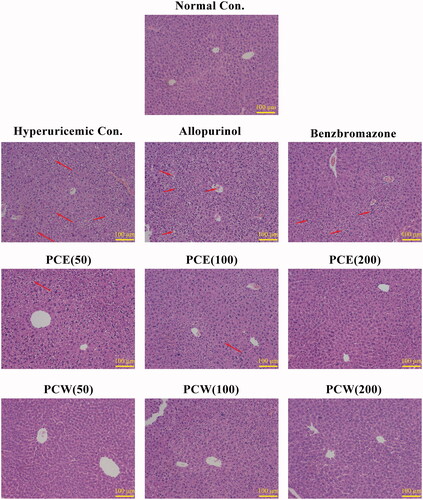
Figure 2. Histological micrographs of kidney tissues stained with H&E: normal control, hyperuricemic control, allopurinol control (5 mg/kg), benzbromarzone control (7.8 mg/kg), PCE (50 mg/kg), PCE (100 mg/kg), PCE (200 mg/kg), PCW (50 mg/kg), PCW (100 mg/kg) and PCW (200 mg/kg). Magnification, ×200 ×; scale bar, 100 μm; red arrow, necrotic and/or inflammatory foci.
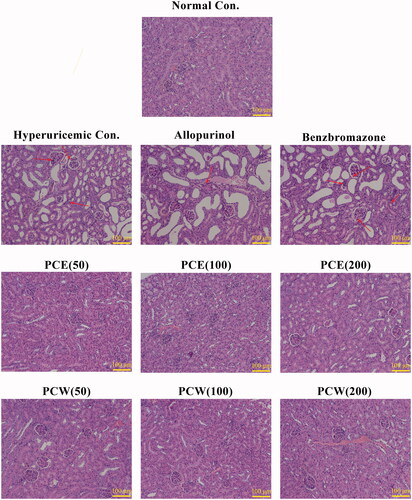
Figure 3. Effects of PCE and PCW on renal ABCG2 (a), OAT1 (b), OAT3 (c), OCT2 (d), GLUT9 (e) and URAT1 (f) mRNA expression. n = 3. * p < 0.05, ** p < 0.01 versus the normal control; # p < 0.05, ## p < 0.01 versus the hyperuricemic control.
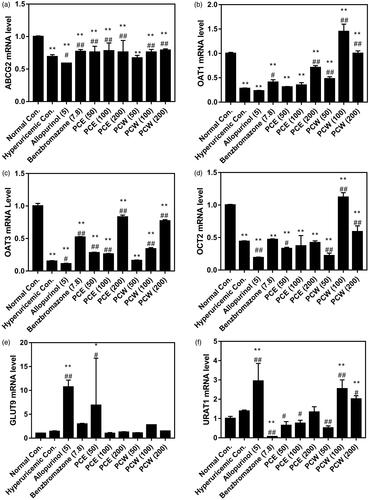
Figure 4. Effects of PCE and PCW on renal ABCG2, OAT3, OAT1 and OCT2 protein expression detected by Western blot: immunoreactive bands (a) and densitometries (b,c,d and –e, expressed as mean ± SD; n n = 3). *p < 0.05, **p < 0.01 versus the normal control; #p < 0.05, ##p < 0.01 versus the hyperuricemic control; △△p < 0.01 versus the allopurinol control.
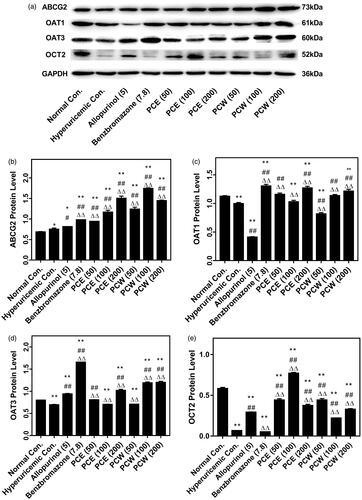
Figure 5. Binding modes of the top five ranked compounds to ABCG2: Cpd267 (a), Cpd277 (b), Cpd13824 (c), Cpd15730 (d) and Cpd5759 (e). The dashed lines represent hydrogen bond or Pi-Cat stacking.
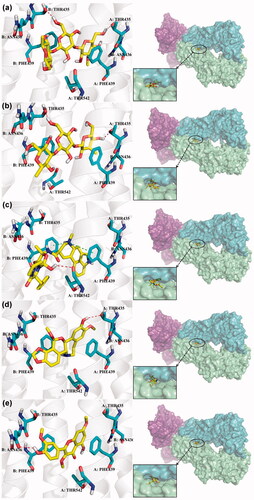
Table 4. Screened compounds and structures from P. cocos for ABCG2 by molecular docking, wherein the in situ compound E1S in ABCG2 served as positive control.