Figures & data
Figure 1. PAE improved cardiac function (EF, FS) and reduced ventricular hypertrophy (HE) in TAC mice. Echocardiography was used to evaluate cardiac function in different groups. PAE prevented the development of cardiac failure in TAC mice. Effect of PAE on FS (A), EF (B), heart weight/body weight (C) and heart weight/tibia length (D). Representative photographs of sections of left ventricle with H&E staining in the different groups (E), quantification of myocardial injury by H&E staining sections. Data were presented as mean ± SD vs. sham group, *p < 0.05, **p < 0.01; vs. TAC group, #p < 0.05, ##p < 0.01, n = 6.
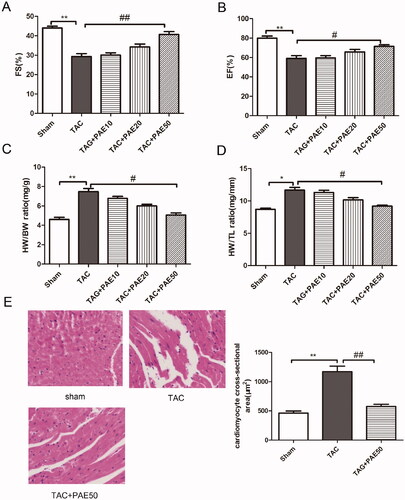
Figure 2. Paeonol reduced the expression of markers related to cardiac hypertrophy in TAC mice. Western blotting assay was performed to assess the expression of ANP, BNP and α-MHC in different groups. Representative blots normalized to β-actin expression were presented (A). The mRNA expression of ANP, BNP and α-MHC in different groups was measured by qRT-PCR analysis (B). The concentration of ANP, TNF-α and IL-6 in the serum was detected via ELISA kits (C). Data were presented as mean ± SD vs. sham group, *p < 0.05, **p < 0.01; vs. TAC group, #p < 0.05, ##p < 0.01, n = 6.
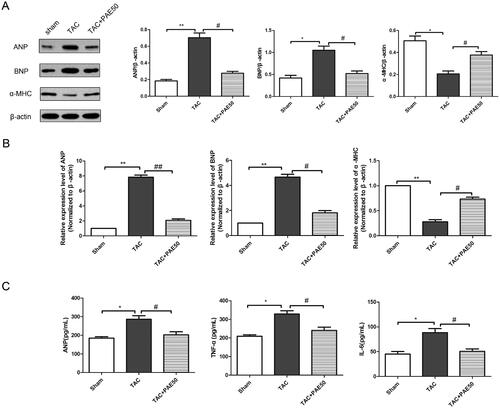
Figure 3. Paeonol inhibited fibrosis and reduced the expression of Col I, CTGF and fibronectin-1 in TAC mice. Representative photographs of sections of left ventricle with Masson trichrome staining in the different groups. Quantitative analysis of cardiac fibrotic area by Masson’s trichromatic staining section (A). The protein level of Col I, CTGF and fibronectin-1 in heart tissue was detected by western blotting assay. (B) Representative blots normalized to β-actin expression were presented. (C) The mRNA expression of Col I, CTGF and fibronectin-1 in heart tissue was detected via qRT-PCR assay. Data were presented as mean ± SD vs. sham group, *p < 0.05, **p < 0.01; vs. TAC group, #p < 0.05, n = 6.
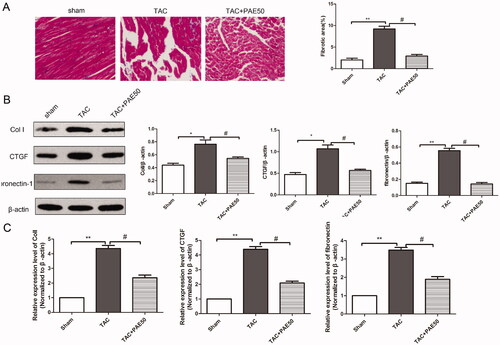
Figure 4. Paeonol reduced cardiac apoptosis in TAC mice. (A) Representative photographs of TUNEL staining in heart sections. Quantitative analysis of TUNEL staining in heart sections. (B) Western blotting assay was performed to assess the expression of Bax, Bcl-2 and cleaved-caspase-3 in heart tissue. Representative blots normalized to β-actin expression were presented. Data were presented as mean ± SD vs. sham group, *p < 0.05, **p < 0.01, ***p < 0.001; vs. TAC group, #p < 0.05, ##p < 0.01, n = 3.
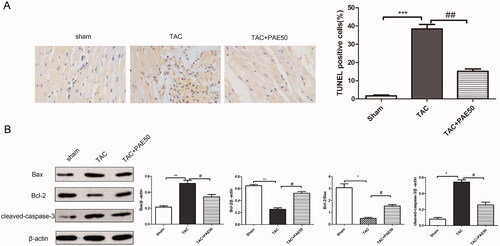
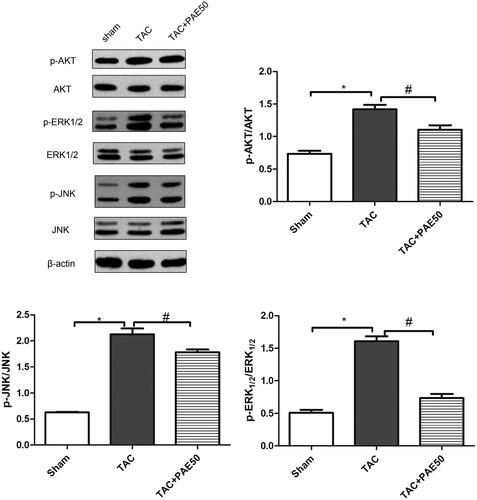
Figure 5. Paeonol inhibited the expression of p-ERK1/2, p-AKT and p-JNK in TAC mice. Western blotting assay was used to detect the ratio of p-AKT/AKT, p-ERK1/2/ERK1/2 and p-JNK/JNK in heart tissue. Representative blots normalized to β-actin expression were presented. Data were presented as mean ± SD vs. sham group, *p < 0.05; vs. TAC group, #p < 0.05, n = 3.