Figures & data
Figure 1. Effects of KG-1 on TNF-α (A), IL-6 (B), CXCL1 (C), CXCL2 (D), and lung histopathological changes (E) in ALI mice. Blue, red, green, violet columns represent the control, model, KG-1, and DXMS group, respectively. **p < 0.01 versus the control group, #p < 0.05, ##p < 0.01 versus the model group. Data are presented as the mean ± SEM (n = 8).
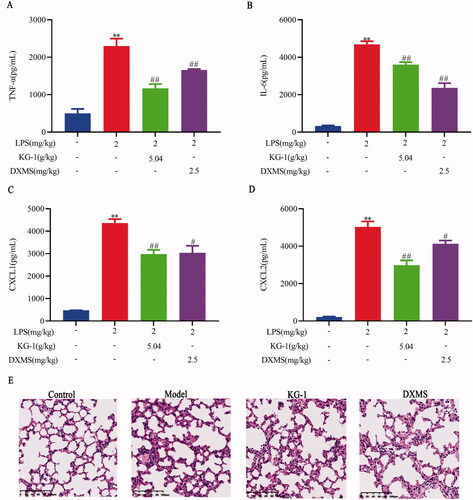
Figure 2. Metabolome profiling for KG-1 anti- ALI in ESI + model. (A,B) PCA and OPLS-DA plots among the control, model and KG-1 groups. (C,E) OPLS-DA plots in the control group [R2X (cum) = 0.214, R2Y (cum) = 0.997, Q2 (cum) = 0.759] or KG-1 group [R2X (cum) = 0.545, R2Y (cum) = 1, Q2 (cum) = 0.869] in comparison to the model group. (D,F) S-plot analysis in the control group or KG-1 group in comparison to the model group. (G) Venn diagram, the intersection of two groups means was the set of variables related to KG-1 anti-ALI. QC sample (n = 5, yellow circle), the control group (n = 8, green box), the model group (n = 8, blue triangle), the KG-1 group (n = 8, red diamond).
![Figure 2. Metabolome profiling for KG-1 anti- ALI in ESI + model. (A,B) PCA and OPLS-DA plots among the control, model and KG-1 groups. (C,E) OPLS-DA plots in the control group [R2X (cum) = 0.214, R2Y (cum) = 0.997, Q2 (cum) = 0.759] or KG-1 group [R2X (cum) = 0.545, R2Y (cum) = 1, Q2 (cum) = 0.869] in comparison to the model group. (D,F) S-plot analysis in the control group or KG-1 group in comparison to the model group. (G) Venn diagram, the intersection of two groups means was the set of variables related to KG-1 anti-ALI. QC sample (n = 5, yellow circle), the control group (n = 8, green box), the model group (n = 8, blue triangle), the KG-1 group (n = 8, red diamond).](/cms/asset/5dd8d570-8236-4c44-910d-003e6b187545/iphb_a_2040544_f0002_c.jpg)
Figure 3. Metabolome profiling for KG-1 anti- ALI in ESI- model. (A,B) PCA and OPLS-DA plots among the control, model and KG-1 groups. (C,E) OPLS-DA plots in the control group [R2X (cum) = 0.38, R2Y (cum) = 0.986, Q2 (cum) = 0.881] or KG-1 group [R2X (cum) = 0.348, R2Y (cum) = 0.996, Q2 (cum) = 0.926]. (D,F) S-plot analysis in the control group or KG-1 group in comparison to the model group. (G) Venn diagram, the intersection of two groups means was the set of variables related to KG-1 anti-ALI. QC sample (n = 5, yellow circle), control group (n = 8, green box), model group (n = 8, blue triangle), KG-1 group (n = 8, red diamond).
![Figure 3. Metabolome profiling for KG-1 anti- ALI in ESI- model. (A,B) PCA and OPLS-DA plots among the control, model and KG-1 groups. (C,E) OPLS-DA plots in the control group [R2X (cum) = 0.38, R2Y (cum) = 0.986, Q2 (cum) = 0.881] or KG-1 group [R2X (cum) = 0.348, R2Y (cum) = 0.996, Q2 (cum) = 0.926]. (D,F) S-plot analysis in the control group or KG-1 group in comparison to the model group. (G) Venn diagram, the intersection of two groups means was the set of variables related to KG-1 anti-ALI. QC sample (n = 5, yellow circle), control group (n = 8, green box), model group (n = 8, blue triangle), KG-1 group (n = 8, red diamond).](/cms/asset/2d13abbb-c58c-45f0-b704-cbf09e9ad826/iphb_a_2040544_f0003_c.jpg)
Figure 4. Global metabolome outline. (A) Radar chart of 12 metabolites with relative abundance among the control group (blue line), model group (red line) and KG-1 group (green line). (B) Pathway enrichment of metabolites. (C) Network schematic diagram of metabolites and involved pathways. In the KG-1 vs model group, the metabolites in the pink box were increased in the KG-1 group; the metabolites in the blue box were decreased in the KG-1 group; the metabolites without box were not detected. Data are presented as the mean ± SEM (n = 8).
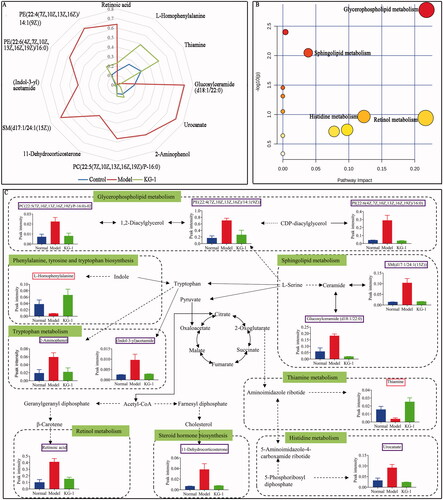
Table 1. The detailed information about 12 metabolites among the control, model and KG-1 groups.
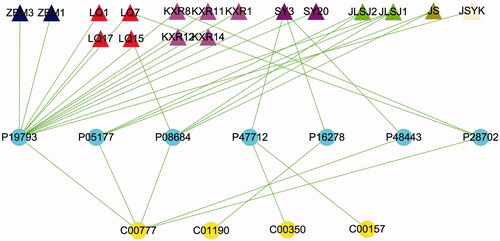
Figure 5. The “compound-target-potential metabolite” interaction network of KG-1 in the treatment of ALI. (A) Overall interaction outline. (B) For those directly involved metabolites and targets in KG-1. The red triangles represent the putative compounds of KG-1; the sky-blue dots represent KG-1 related to putative targets; the purple dots represent potential metabolites related to putative targets.
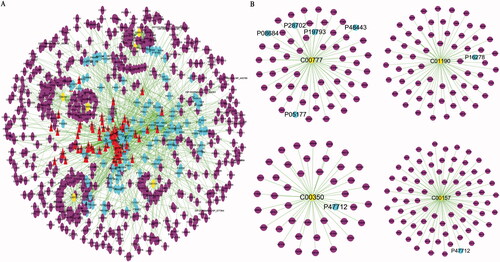
Figure 6. The “compound-target-potential metabolite” simplified interactive network. The navy blue, red, pink, purple, light-green, dark-green, light-yellow triangles represent the putative active compounds of ZBM (Zhebeimu), LQ (Lianqiao), KXR (Kuxingren), SY (Sangye), JLSJ (Jinyinhua-Liaoqiao-Sangye-Juhua), JS (Jinyinhua-Sangye), JSYK (Jinyinhua-Sangye-Yiyiren-Kuxingren), respectively; the yellow dots represent the candidate metabolites; the sky-blue dots represent the shared targets of KG-1 and potential metabolites.