Figures & data
Table 1. Training scheme for rats with exercise-induced low serum testosterone levels (meters/min × min).
Table 2. List of primer sequences for PCR.
Figure 1. HPLC chromatogram analysis of (A) Mixed reference, (B) Epimedii folium extract, and (C) Bushen Yiyuan recipe. 1 = Ginsenoside Rg1, 2 = Ginsenoside Re, 3–6 = Components from Epimedii folium, 7 = Icariin, 8 = Ginsenoside Rb1, 9 = Ginsenoside Rc, 10 = Ginsenoside Rb2, 11 = Ginsenoside Rd with retention time 19.35, 20.23, 32.08, 34.17, 35.83, 37.01, 38.14, 49.99, 50.83, 51.75, and 54.85 min, respectively.
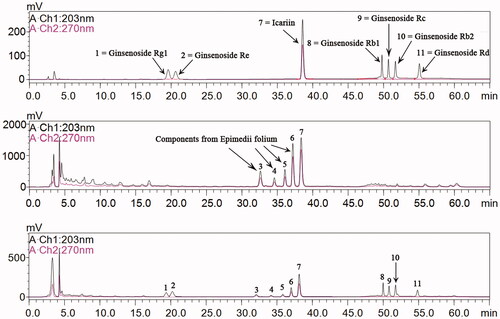
Figure 2. Testosterone, cortisol, testosterone/cortisol, total cholesterol, HDL-C and LDL-C levels in rats of normal group, model group, Epimedii folium extract (EFE) group, low-dose Bushen Yiyuan recipe (BYR) group and high-dose Bushen Yiyuan recipe (BYR) group. Data are expressed as the mean ± SD (n = 8), evaluated using one-way ANOVA. #p < 0.05, ##p < 0.01, compared with the normal group. **p < 0.01, compared with the model group.
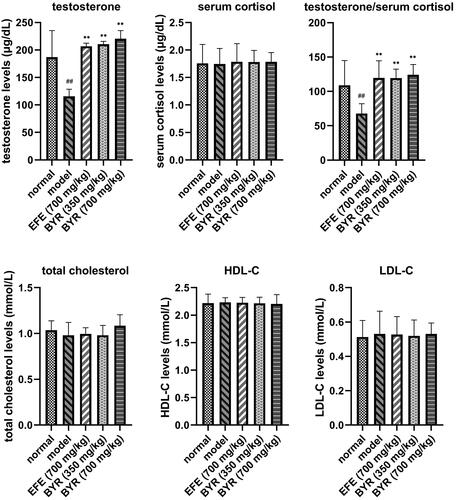
Figure 3. Ultrastructure of Leydig cells of rats of normal group (A), model group (B), arrowheads indicate many mitochondrial vacuoles were changed. Epimedii folium extract (EFE) group (C), arrowhead indicates ruptured cell membranes. Low-dose Bushen Yiyuan recipe (BYR) group (D), arrowheads indicate lysosomes increased. high-dose Bushen Yiyuan recipe (BYR) group (E), arrowheads indicate chromatin of some cells condensed in margin and lysosomes increased.
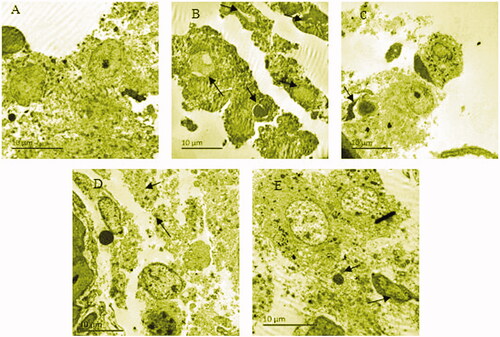
Figure 4. mRNA expression fold changes of HMG-CoA, LDL-R, SR-BI, STAR and CYP11A1 in rat Leydig cells of model group, Epimedii folium extract (EFE) group, low-dose Bushen Yiyuan recipe (BYR) group and high-dose Bushen Yiyuan recipe (BYR) group. Data are expressed as the mean ± SD (n = 8), evaluated using one-way ANOVA. #p < 0.05, ##p < 0.01, compared with normal group. *p < 0.05, **p < 0.01, compared with model group. &p < 0.05, &&p < 0.01, compared with Epimedii folium extract (EFE) group.
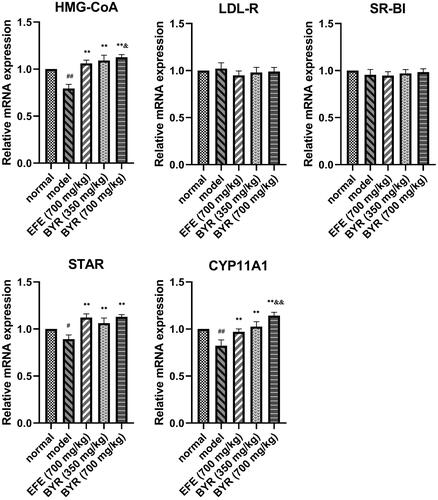
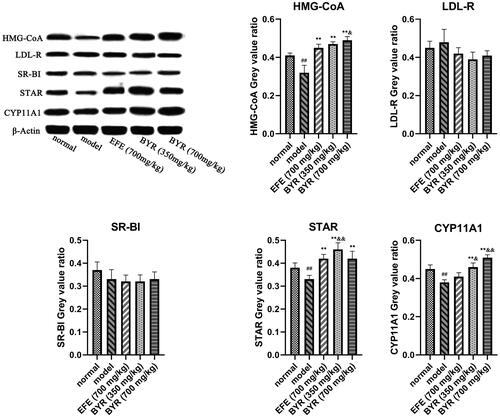
Figure 5. Protein expression of HMG-CoA, LDL-R, SR-BI, STAR and CYP11A1 in rat Leydig cells of model group, Epimedii folium extract (EFE) group, low-dose Bushen Yiyuan recipe (BYR) group and high-dose Bushen Yiyuan recipe (BYR) group. Data are expressed as the mean ± SD (n = 8), evaluated using one-way ANOVA. #p < 0.05, ##p < 0.01, compared with the normal group. *p < 0.05, **p < 0.01, compared with the model group. &p < 0.05, &&p < 0.01, compared with Epimedii folium extract (EFE) group.