
Figures & data
Figure 1. Effect of PC95E fractions on cell viability of WS-1 cells. WS-1 cells were seeded in a 48-well plate and treated with PC95E fractions (50 μg/mL) for 24 h. Vitamin C (ascorbic acid, 50 μM) was used as a positive control. Cell viability was measured by a MTT assay. Results are expressed as a ratio relative to the control. Each determination was performed in triplicate, and values are presented as mean ± standard deviation. *p < .05 and **p < .01 vs. the control group.
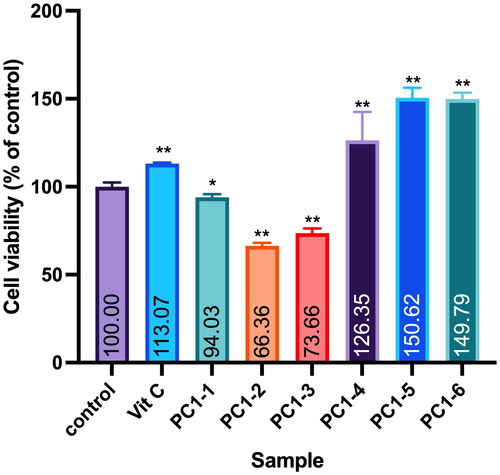
Table 1. Sequence of primers for the human MMP-1, COL1A1 and GADPH genes.
Table 2. Extraction rates of Pyrus calleryana (PC) samples from different months.
Table 3. Total phenolic contents of Pyrus calleryana (PC) extracts.
Table 4. Total triterpenoid contents of Pyrus calleryana (PC) extracts.
Table 5. DPPH radical-scavenging activities of Pyrus calleryana (PC) extracts.
Figure 2. Principal component analysis of four Pyrus calleryana (PC) extracts from August. PC-LE08: 95% ethanol leaf extract of PC; PC-LH08: water leaf extract of PC; PC-SE08: 95% ethanol twig extract of PC; PC-SH08: water twig extract of PC.
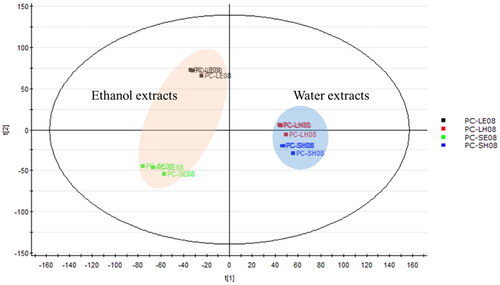
Figure 3. Principal component analysis of Pyrus calleryana (PC) ethanol twig (SE) extracts from different months. PC-SE01–12: 95% ethanol twig extract collected in different months (January–December).
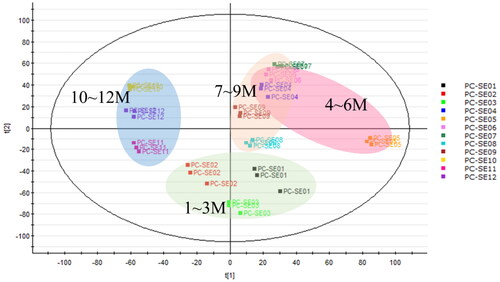
Figure 4. Molecular network of Pyrus calleryana (PC) extract in negative mode. (A) Chemicals classified according to ClassyFire parents. (B) Structures of isolates from the 95% ethanol (PC95E) extract and annotations from the GNPS library.
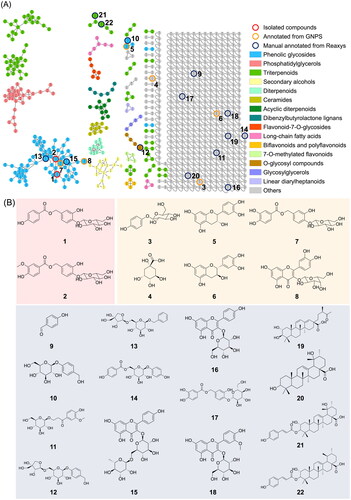
Figure 5. Molecular network of Pyrus calleryana (PC) ethanolic twig (SE) extracts from different months coloured according to month. PC-SE extracts were analysed using LC–MS/MS, and chromatograms were exported to GNPS for molecular networking. Nodes in the network are coloured according to the mean precursor ion intensity of extracts from each month. Molecular families A (phenolic glycosides), B (phosphatidylglycerols), and C (triterpenoids) are highlighted.
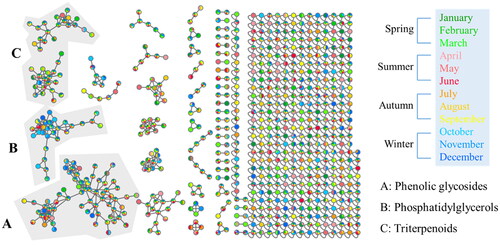
Figure 6. Effects of compounds 3′-hydroxylbenzyl-4-hydroxybenzoate-4′-O-β-glucopyranoside (1) and vanilloylcalleryanin (2) on cell viability of WS-1 cells. WS-1 cells were seeded in a 48-well plate and treated with compounds (100 μM) isolated from Pyrus calleryana for 24 h. Vitamin C (ascorbic acid, 100 μM) was used as a positive control. Cell viability was measured by an MTT assay. Results are expressed as a ratio relative to the control. Each determination was performed in triplicate, and values are presented as the mean ± standard deviation.
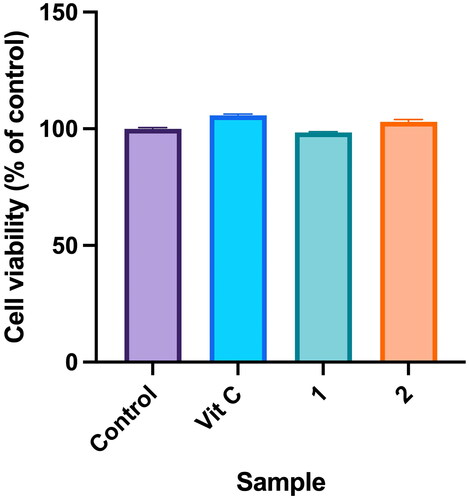
Figure 7. Effects of compounds 3′-hydroxylbenzyl-4-hydroxybenzoate-4′-O-β-glucopyranoside (1) and vanilloylcalleryanin (2) on the cell migration of WS-1 cells. (A) Wound-healing assay of WS-1 cells incubated with different concentrations of the 95% ethanolic extract of Pyrus calleryana (PC95E) compounds. (B) Cells were treated with compounds (60, 80 and 100 μM) isolated from PC for 24 h. Vitamin C (ascorbic acid, 100 μM) was used as a positive control. Photos were taken before and after treatment, and scratched areas were measured using ImageJ software (Bethesda, MD). Cell migration rates were calculated. Each determination was performed in triplicate, and values are presented as the mean ± standard deviation. **p < .01 vs. the control group.
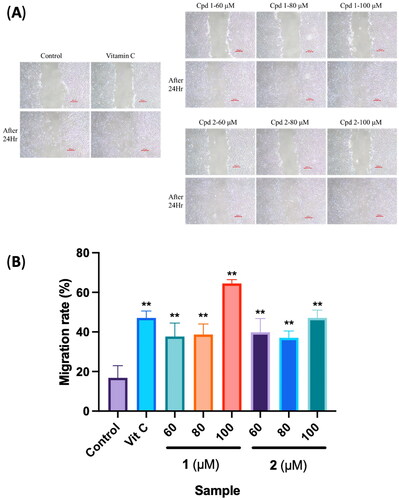
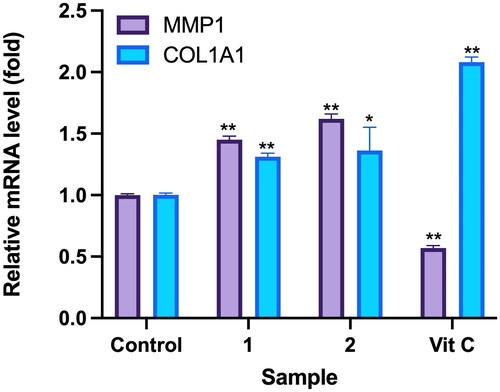
Figure 8. Effects of compounds 3′-hydroxylbenzyl-4-hydroxybenzoate-4′-O-droxylbenzyl-4-hy (1) and vanilloylcalleryanin (2) on gene expression by WS-1 cells. WS-1 cells were seeded in 6-cm dishes and treated with compounds (100 μM) isolated from Pyrus calleryana for 24 h. Vitamin C (ascorbic acid, 100 μM) was used as a positive control. RNA extraction, reverse transcription and a real-time PCR were performed. Each determination was performed in triplicate, and values are presented as the mean ± standard deviation. *p < .05 and **p < .01 vs. the control group.
Data availability statement
Data will be made available upon reasonable request.