Figures & data
Figure 1. Flow chart of patient inclusion.
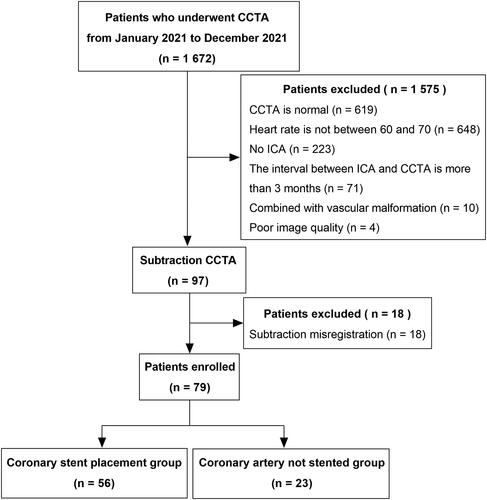
Table 1. Clinical baseline data of patients.
Figure 2. The patient, male, 71 years old, was admitted to the hospital with ‘increased blood pressure for more than 20 days’. Figure A, conventional CCTA; Figure B, conventional FFR-CT; Figure C, ICA; Figure D subtraction CCTA; Figure E, post-subtraction FFR-CT; Figure F, PCI. CCTA showed severe segmental calcified plaque in the proximal segment of the LAD, with severe luminal stenosis (Figure A, white arrows), and the FFR-CT measurement value was 0.84 (Figure B), and ICA was performed to show severe stenosis of the LAD proximally (Figure C, white arrows). The lumen of the LAD was clearly shown post-subtraction, with severe proximal stenosis (Figure D, white arrows), and FFR-CT measurement value was 0.74 (Figure E). PCI was given after evaluation by interventional cardiovascular specialists, and after the procedure the proximal segment of the LAD was well filled and the lumen did not show any stenosis (Figure F, red arrow).
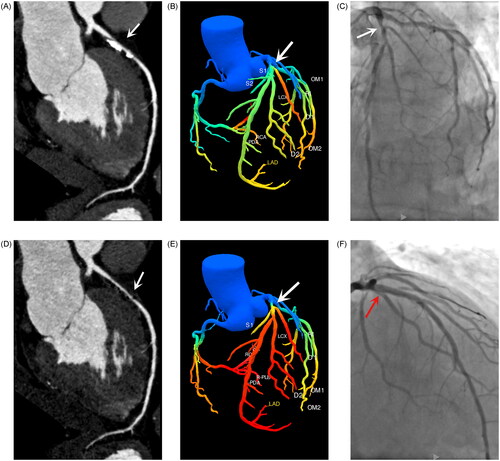
Table 2. Characteristics of coronary artery stenosis.
Table 3. Distance of each FFR-CT measurement position from the coronary artery opening for conventional and post-subtraction imaging.
Table 4. Accuracy and efficacy analysis of FFR-CT in predicting early revascularization at patient and vascular level.
Figure 3. Comparison of accuracy, sensitivity, and specificity of conventional and post-subtraction FFR-CT measurements ≤ 0.8 for predicting early coronary revascularization, a is patient level, B is vessel level. FFR-CT: fractional flow reserve with computed tomography; P: P value.
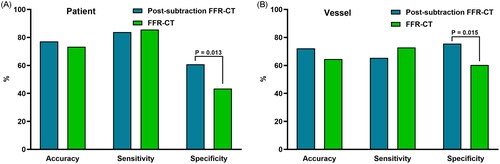
Table 5. Diagnostic efficiency of post-subtraction ΔFFR-CT in predicting early revascularization in the narrowest region.
Figure 4. ROC Curve comparison between conventional and post-subtraction FFR-CT. A and B are patient level FFR-CT measurements and ΔFFR-CT values, respectively, and C and D are vessel level FFR-CT measurements and ΔFFR-CT values, respectively. ΔFFR-CT: difference in FFR-CT values proximal and distal to the narrowest point of the vessel; FFR-CT: fractional flow reserve with computed tomography; P: P value.
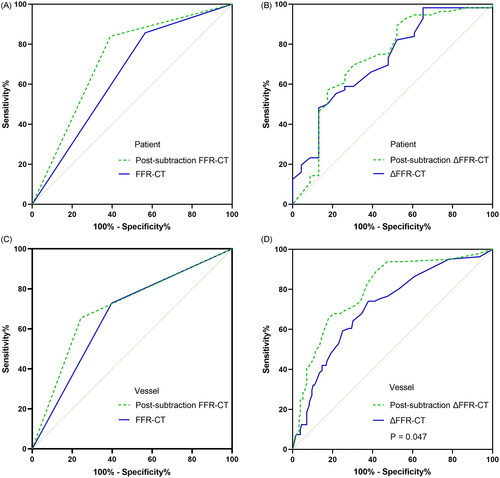
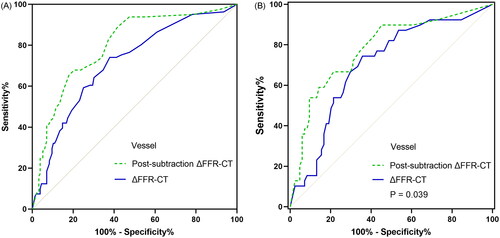
Figure 5. Comparison of ROC curves between conventional and post-subtraction ΔFFR-CT after further stratification by CACS; a and B are comparisons of AUC at the vessel level with CACS < 400 and ≥ 400, respectively. ΔFFR-CT: difference in FFR-CT values proximal and distal to the narrowest point of the vessel; AUC: area under the curve; CACS: coronary artery calcium score; FFR-CT: fractional flow reserve with computed tomography; P: P values.