2,276
Views
1
CrossRef citations to date
0
Altmetric
Articles

U.S. state higher education appropriations: assessing the relationships between agency politicization, centralization, and volatility

, , &

Figures & data

Figure 1. Scatterplot of average state general own-source revenue volatility and volatility in state higher education appropriations (absolute value presented).
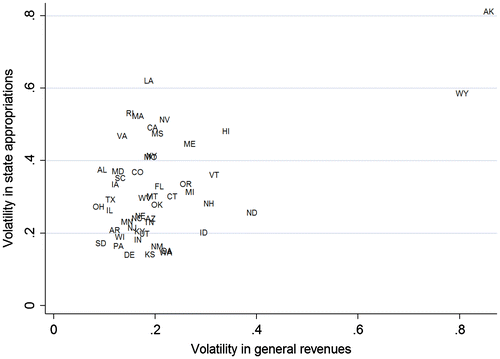
Figure 1. Scatterplot of average state general own-source revenue volatility and volatility in state higher education appropriations (absolute value presented).

Figure 2. State fiscal policy framework for higher education. Source: Adapted from Tandberg (Citation2010b); Figure 2; With permission of Springer, Copyright © 2010.
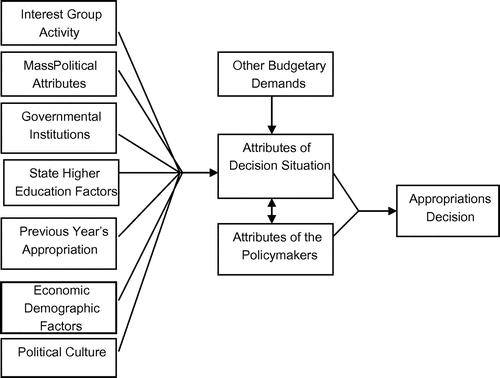
Figure 2. State fiscal policy framework for higher education. Source: Adapted from Tandberg (Citation2010b); Figure 2; With permission of Springer, Copyright © 2010.
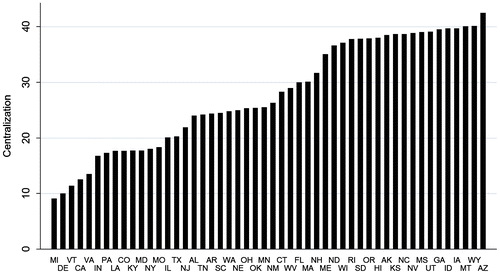
Figure 3. Centralization of state postsecondary governance, 2009.

Figure 3. Centralization of state postsecondary governance, 2009.

Table 1 Descriptive Statistics, standard deviation in parentheses.

Table 2 Results from the base and fully interacted models.