
Figures & data
Table 1. Developmental trajectories of CGRs in the database
Figure 1. Lifecycle trajectories. Numbers refer to the cases in.. Developmental stages follow Imperial et al. (Citation2016)
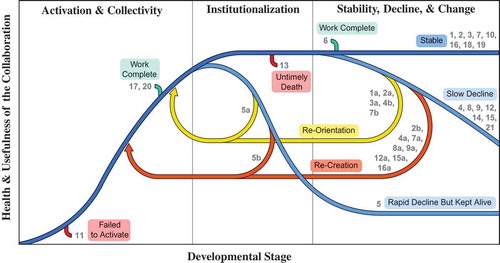
Table 2. Reported mean process characteristics over time, standard deviation in parentheses
Figure 2. Mean trajectories of EEI, disaggregated by initiation type (left) and developmental trajectory (right)
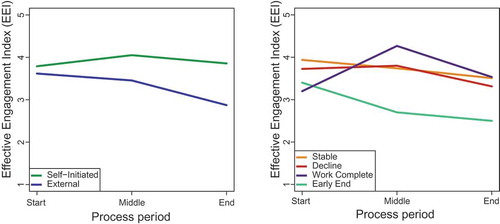
Figure 3. Count of leadership distribution across time, disaggregated by initiation type
Table 3. Reported mean leadership quality over time, standard deviations in parentheses
Figure 4. Mean trajectories of SLI, disaggregated by initiation type (left) and developmental trajectory (right)
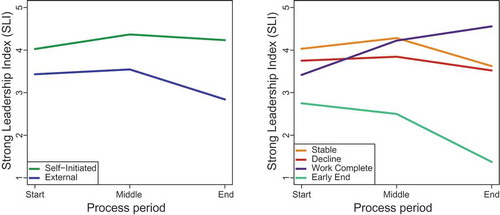
Table 4. Reported mean accountability over time, standard deviations in parentheses
Figure 5. Mean trajectories of ACI, disaggregated by initiation type (left) and developmental trajectory (right)
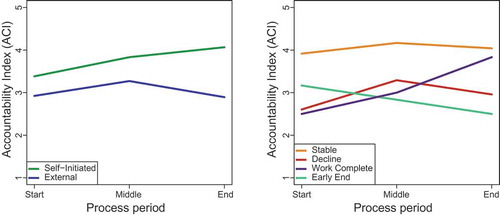
Figure 6. Mean reported outputs/outcomes over time, disaggregated by initiation type
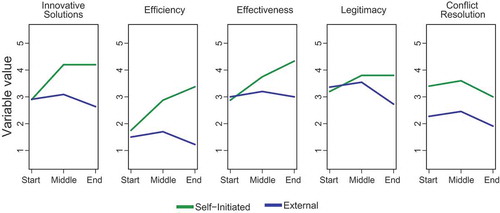
Figure 7. Mean reported outputs/outcomes over time, disaggregated by developmental trajectory
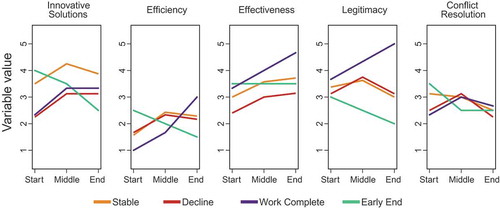
Table 5. Correlations between process and outcome variables across time periods
Table A1. Correlations between process and outcome variables across time periods