
Figures & data
Figure 1. Left: land cover of the test field with images perspective centres, ground control points and check point’s location. Right: the location of the photogrammetric block (black configuration) in Sweden.

Figure 2. Systematic shift and linear drift errors, modified after Trimble (Citation2015).
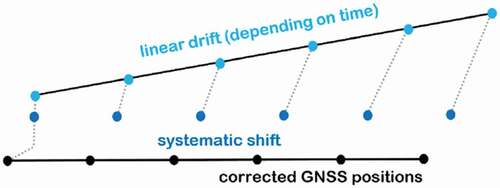
Table 1. The number of rejected images and checkpoint RMS of some best case, worst case and Lantmäteriet default (*) values for observable uncertainties.
Figure 3. The minimum number of rejected images when using 0.007, 0.007
and 0.009
uncertainties for
also 0.2 m uncertainties for
, respectively.
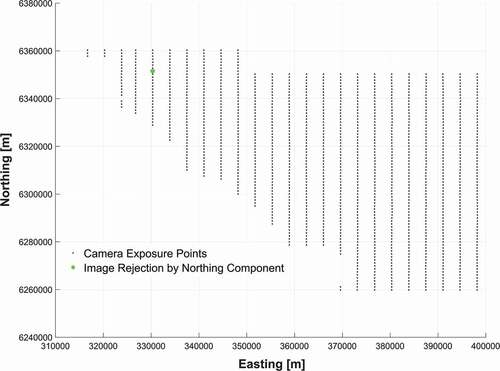
Figure 4. The maximum number of rejected images when using 0.001, 0.001
and 0.001
uncertainties for
also 0.2 m uncertainties for
, respectively (all images rejected by
but it is not shown in this figure).
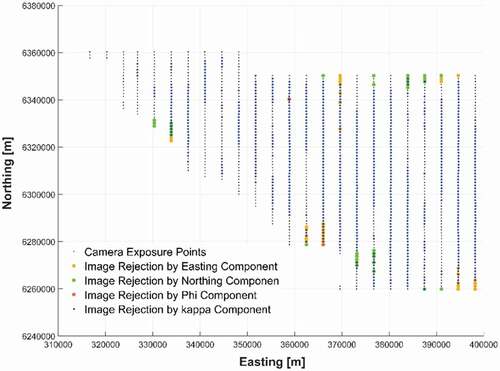
Figure 5. Comparison of checkpoints’ vertical residual vectors for case 1 (red vectors) and case 2 (blue vectors) on land cover. Blue vectors have an offset from their initial location due to a better display.
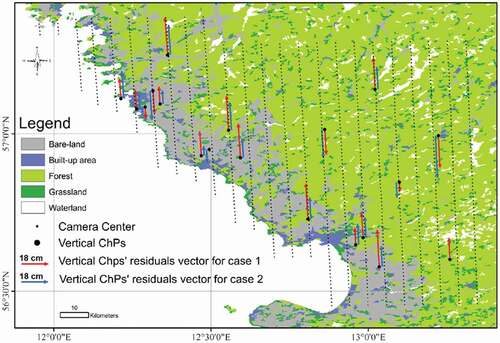
Table 2. Statistical analysis for elevation differences between LiDAR’s DTM and Photogrammetry DSMs.