Figures & data
Table 1. Descriptive statistics for all students and fast-track students in fast-track schools.
Figure 1. Density plot of results on 8th grade national tests in mathematics (z-scores) among fast-tracked students and all other students.
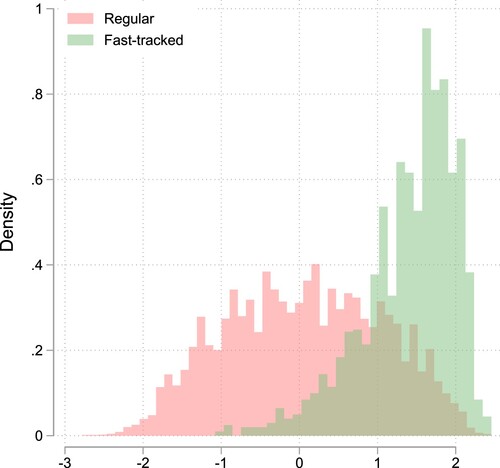
Table 2. Probability of fast-track participation in math dependent on student background controlling for national tests (NT) in math, reading and English.
Figure 2. Estimated shares in fast-track in mathematics by social class origin, with and without control for results on national tests.
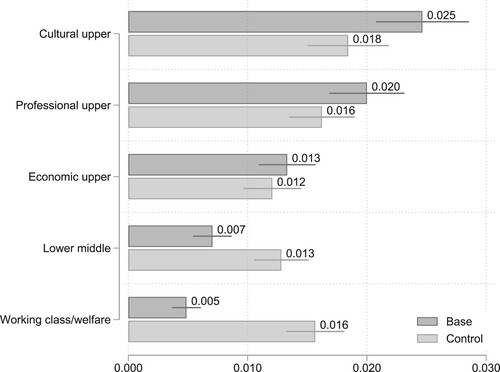
Figure 3. Estimated shares in fast-track in mathematics by immigrant status, with and without control for results on national tests.
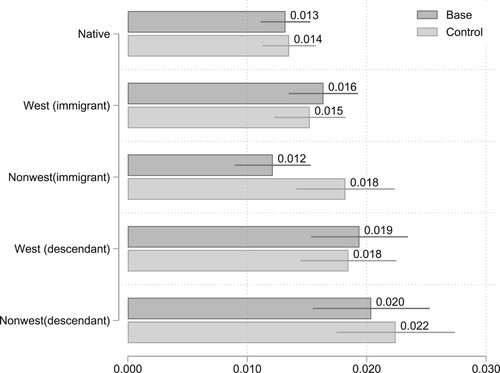
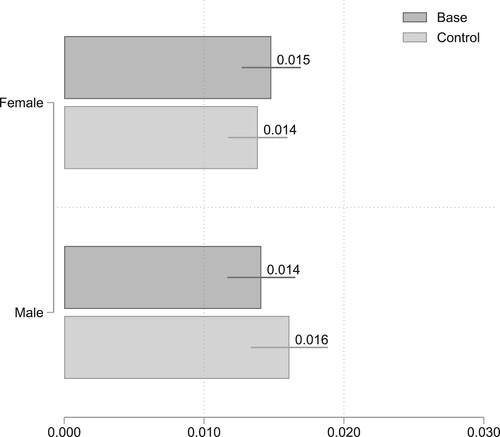
Figure 4. Estimated shares in fast-track in mathematics by sex, with and without control for results on national tests.