
Figures & data
Table 1. Descriptives of variables used in the analysis, CILS4EU data, Swedish and German part. N = 7,472.
Table 2. Descriptives of friendship networks (‘Who are your best friends in class?’), CILS4EU data, German and Swedish part. N = 358.
Figure 1. Heatmaps of cross-tabulation maths confidence and maths grades, by country (CILS4EU data).
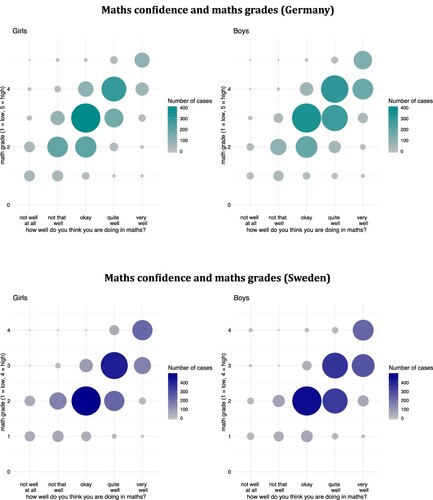
Figure 2. Bivariate associations of maths confidence and individual-level characteristics (CILS4EU data, wave 1).
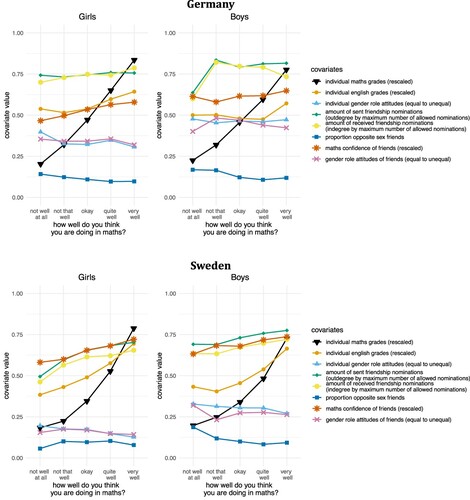
Figure 3. Coefficient plot of main results, multilevel stochastic actor-oriented models (SAOMs), maths confidence part of the model. The plot shows the posterior mean and the credibility interval. Separate effects for gender are based on the sum of the respective main and interaction effect (for girls), and the main effect (for boys). For full results, please see Table A.11, as well as Tables A.12 to A.15.
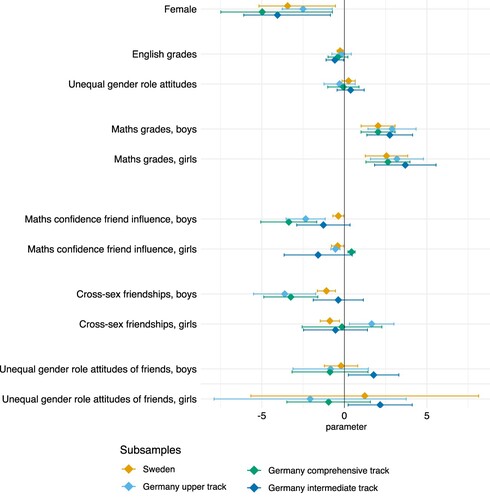
Figure 4. Heatmaps of ego-alter selection table based on maths confidence, by friendship gender selection pattern and sub-sample. Cells are coloured according to the relative gain to ego’s objective function when choosing alters with various levels of maths confidence (red = more positive, blue = more negative). Whether differences in the relative gain between the extreme cases are significantly different from zero is shown by arrows, pointing from the lower to the higher value.
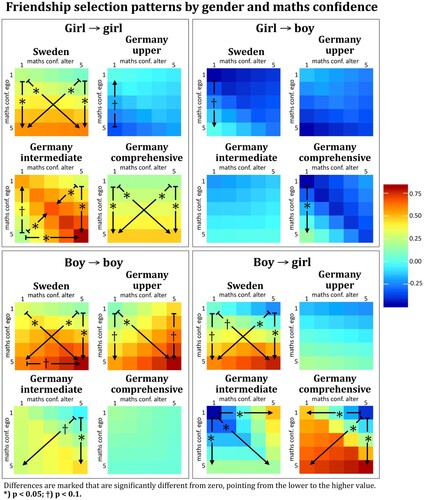
Table 3. Proportion of women enrolled in and graduating from selected STEM subjects in 1998 and 2018.
Supplemental Material
Download Zip (456.4 KB)Data availability statement
The data that support the findings of this study are available at GESIS: https://search.gesis.org/research_data/ZA5656.
DOIs:
10.4232/cils4eu.5656.1.1.0 (wave 1).
10.4232/cils4eu.5656.2.1.0 (wave 2).
We provide a replication package that contains the R scripts for data preparation and analysis.