
Figures & data
short-legendFigure 1. Automated shuttle by Robosoft on a public road in a mixed traffic situation in Trikala, Greece. 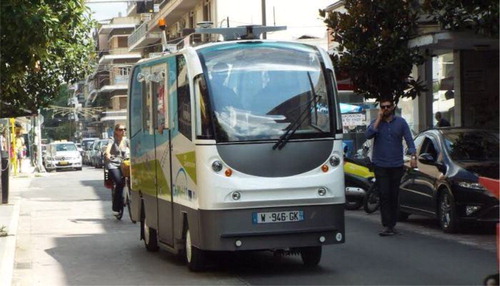
Figure 2. Significant structural path relationships in second model. Dashed arrows denote moderation effects.
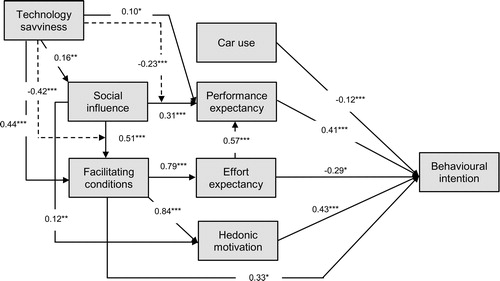
Table 1. Measurement of study variables.
Table 2. Descriptive statistics and results of the confirmatory factor analysis.
Table 3. Inter-construct correlation matrix.
Table 4. Structural equation models: hypothetical path, standardized path coefficients (β), and variance explained (R 2 ).