
Figures & data
Figure 1. BDP (Citation2011) designed school: Central atrium, image by Trafi-Prats, L (28/11/2021).
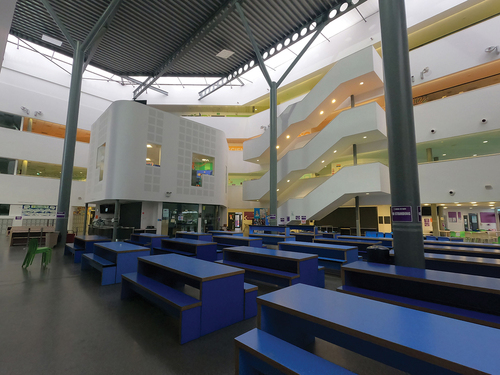
Figure 2. Semantic network map of the design and access statement for the school, created using cortext (https://www.cortext.net/) and Gephi.
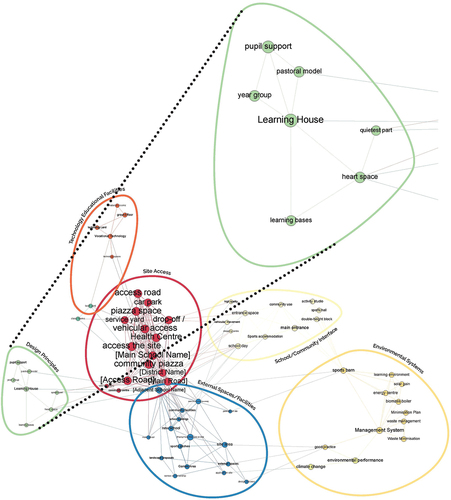
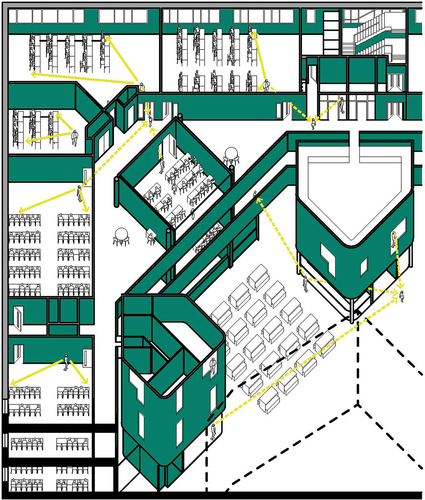
Figure 3. Axonometric diagram of sightlines of the BDP (Citation2011) school building, showing significant passive surveillance of circulation spaces.
Data availability statement
Data associated with this project can be found here:
Trafi-Prats (Citation2023). Mapping Spatial Practices and Social Distancing in Smart Schools: Sensory and Digital Ethnographic Methods. [Data Set]. MMU e-space. DOI: 10.23634/MMU.00631426.

