18,069
Views
23
CrossRef citations to date
0
Altmetric

Figures & data

Figure 1. The share of state-owned firms of the value (in USD) of all cross-border mergers and acquisitions (M&As) per year. Only completed deals are counted. Source: own calculation on basis of Bureau van Dijk’s ORBIS Zephyr data (February 2020).
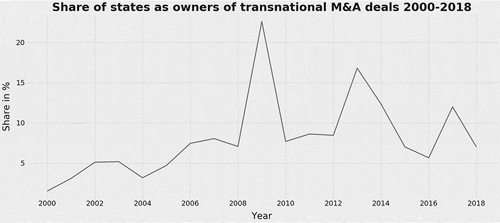
Figure 1. The share of state-owned firms of the value (in USD) of all cross-border mergers and acquisitions (M&As) per year. Only completed deals are counted. Source: own calculation on basis of Bureau van Dijk’s ORBIS Zephyr data (February 2020).

Figure 2. North European transportation and storage cluster. The invested states are on the left side. The percentage relates to the total foreign state investment into this cluster by the largest 20 sovereign investors. Investment data is based on Bureau van Dijk’s ORBIS database (December 2017). For the calculation of the investment size see Babic, Garcia-Bernardo, and Heemskerk (Citation2020) (appendix).
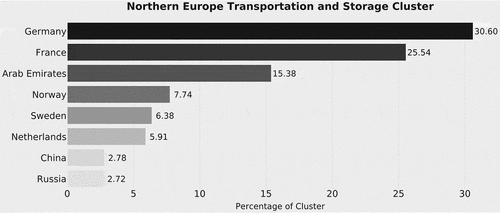
Figure 2. North European transportation and storage cluster. The invested states are on the left side. The percentage relates to the total foreign state investment into this cluster by the largest 20 sovereign investors. Investment data is based on Bureau van Dijk’s ORBIS database (December 2017). For the calculation of the investment size see Babic, Garcia-Bernardo, and Heemskerk (Citation2020) (appendix).