
Figures & data
Figure 1 Example screenshot of manual slope determination with the MAESTRO software as seen by the analyst (the red dashed lines shown here are not visible in MAESTRO as well as the black annotations)
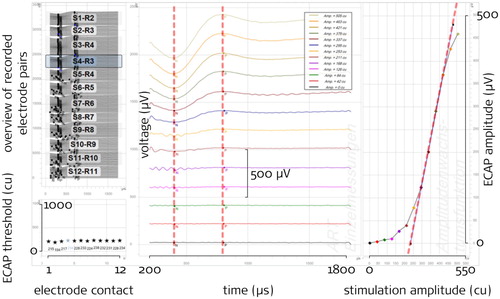
Figure 2 A simple model showing the dependency of the ECAP threshold and slope from the distance between stimulation electrode contact and neurons and neural density. The three upper panels a, b, c depict ‘neurons’ as open and filled circles, at different distances from the stimulation site: open if they are not excited by the stimulation and filled if they are with increasing stimulation amplitude. The bottom panel shows the number of excited neurons as a function of the stimulation amplitude for the three geometric configurations. This corresponds to the AGF when, for this discussion, assuming that each neuron contributes equally to the ECAP signal. (a) depicts a case with dense neurons and small distance stimulation-site to neurons, causing low threshold and steep slope. (b) corresponds to (a) except for a lower neural density: The threshold remains the same, whereas the resulting slope is shallower. (c) has the same neural density as (a) but increased distance and lesser overall number of neurons, causing greater threshold but the same slope
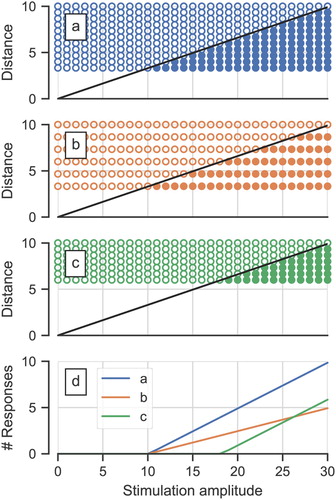
Table 1 Participants. Ear ID 220/259 and 244/255 are bilaterally sequentially implanted participants
Table 2 Available measurements per ear and point in time
Table 3 Setting used for ECAP recordings with the ‘ART’ task of MAESTRO
Table 4 Number of successfully measured/determined slopes per point in time and (physical) electrode contact
Table 5 Number of missing slope recordings per (physical) electrode contact and point in time due to exclusion of measurement or unsuccessful determination of slope
Figure 3 Individual ECAP AGF slope values per ear, physical electrode contact and point in time
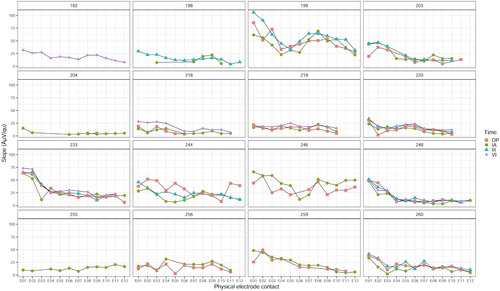
Figure 4 ECAP AGF slopes for all ears and all compensated electrode contacts at all four points in time in µV/qu
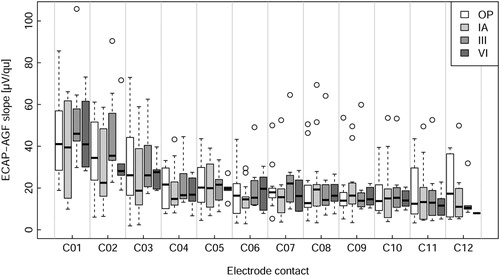
Figure 5 Model outcome: Intercept: Best guess of ‘overall’ slope referenced to electrode C07 at initial activation. Electrode: model prediction of correction of slope for different electrodes. Time: model prediction of correction for different points in time: OP, III and VI. An effect is considered significant if the confidence interval does not contain 0 (shaded). The estimate in numbers is presented in
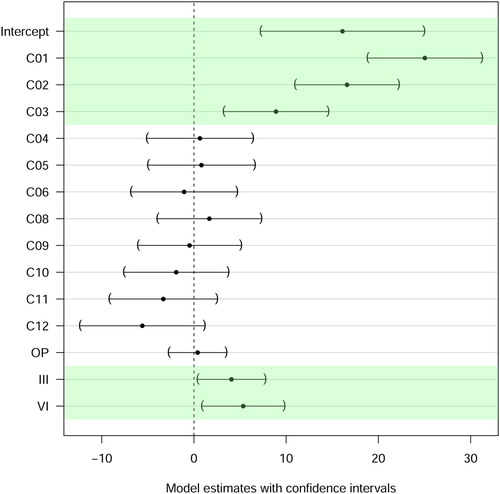
Table 6 ANOVA table comparing the cascade of models: Baseline Model; Electrode Model; Electrode + Time Model; Electrode + Time + Interaction Model
Table 7 Simultaneous tests for general linear hypotheses from the model