Figures & data
Table 1. The means and standard deviations attitudes perceptions in relation to burnout.
Table 2. Correlations between all main variables (N = 120)ᵃ.
Table 3. Regression analysis predicting general burnout using the backward method.
Table 4. Regression analysis predicting diversity-related burnout using the backward method.
Table 5. Means and standard deviations (in parentheses) scores by clusters.
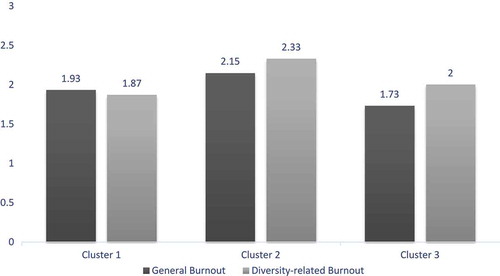
Figure 1. Mean general and diversity-related burnout scores by cluster.