Figures & data
Figure 1. ESEM images of CRM processed by (a) ambient grinding (b) cryogenic grinding, adapted from (Shen & Amirkhanian, Citation2007).
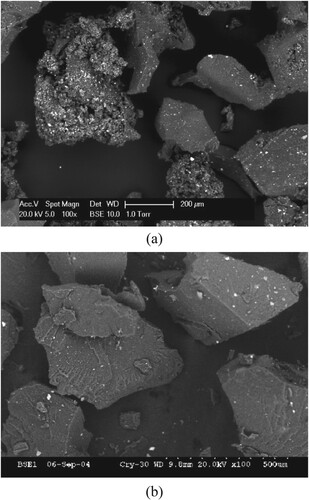
Table 1. Basic properties of CRM.
Figure 2. ESEM sample preparation process (a) heat and casting (b) flattening and transferring (c) storing.
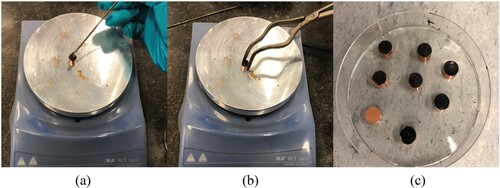
Figure 3. Laboratory equipment used to prepare CRMA binders.
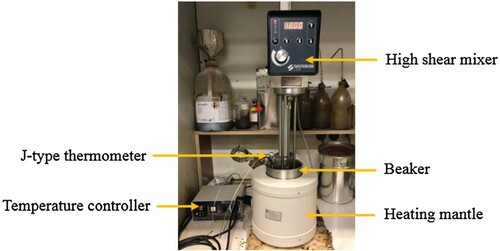
Figure 4. ESEM apparatus (a)entirety (b) sample on the stage in the chamber.
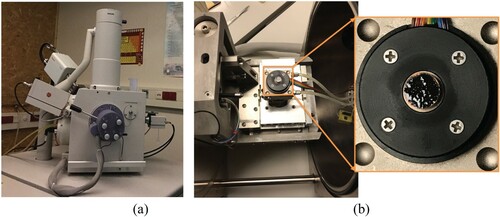
Figure 5. ESEM image and EDX spectrum of ambient CRM.
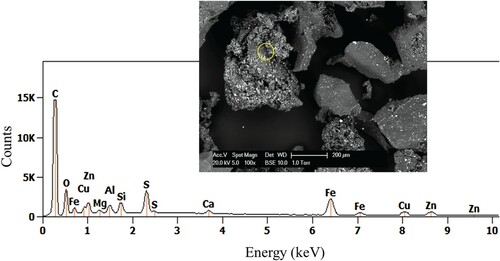
Figure 6. ESEM images for asphalt-rubber blend at different interaction conditions.
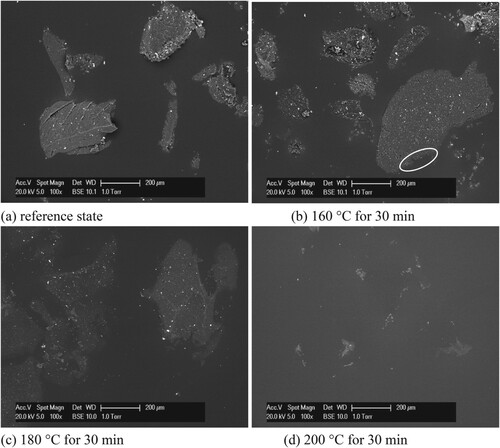
Figure 7. EDX spectrum of asphalt-rubber blend interacted at 160°C.
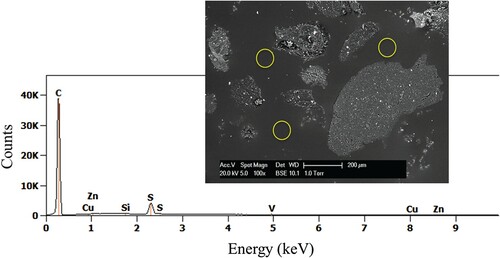
Figure 8. Creep and recovery cycle at 3.2 kPa for CRMA binders prepared at different temperatures.
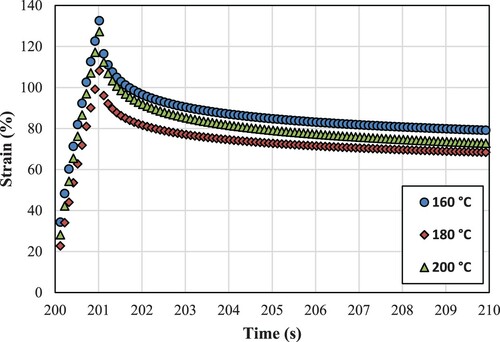
Figure 9. MSCR test results as a function of interaction temperature and time: (a) Nonrecoverable creep compliance and (b) percentage of recovery.
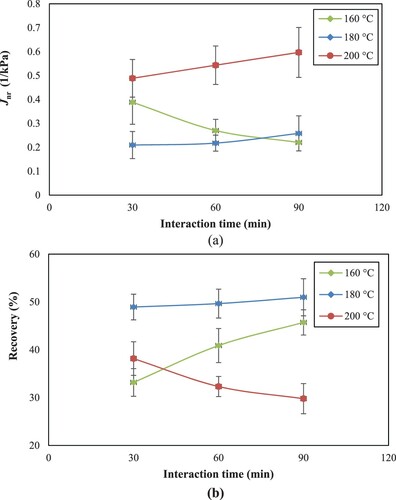
Figure 10. Schematic diagram of asphalt-rubber interaction stages.
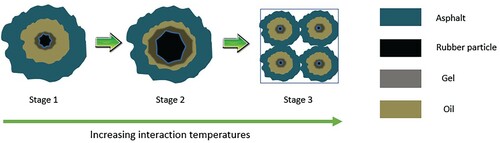
Table 2. MSCR test results of different asphalt binders.
Figure 11. Shear stress and strain output from LAS test for different binders.
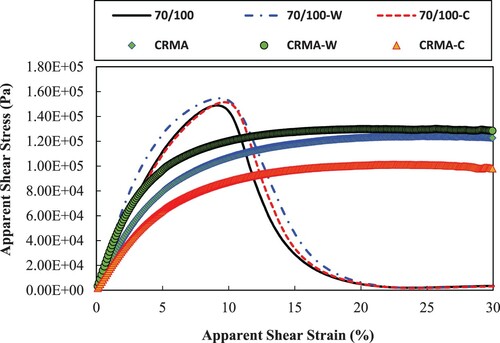
Figure 12. LAS material integrity versus damage intensity curves of (a) base asphalt with and without WMA additives, (b) CRMA binder with and without WMA additives, (c) comparison between experimental data and model fitting of CRMA binder.
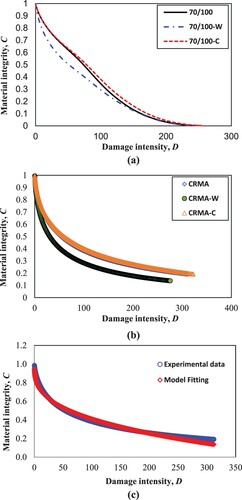
Table 3. Analysis of LAS results.
Figure 13. Correlation between predicted fatigue life and failure energy.
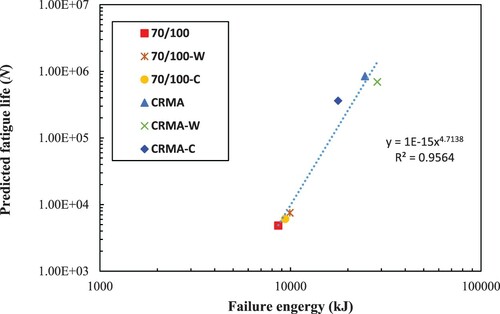
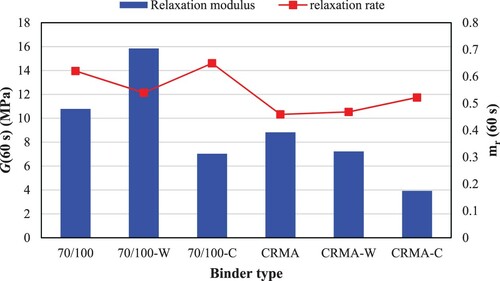
Figure 14. Master curve of shear stress relaxation modulus G(t) at a reference temperature of −10°C.
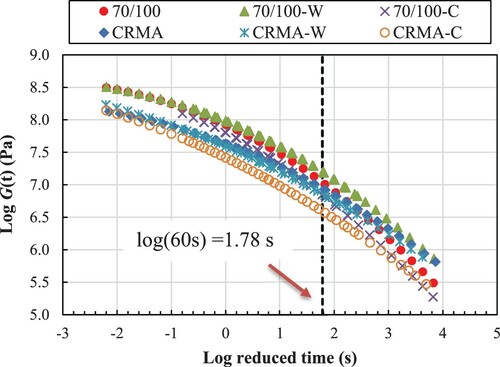
Table 4. Analysis of shear relaxation modulus master curve.
Figure 15. Derived and
values of different binders at −10°C.